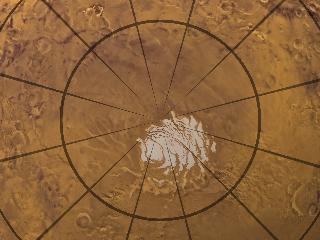
A Rotating False Color View of the Martian South Pole from MOLA
This is one of a series of visualizations showing false-colored renderings of the Martian topography measured by MOLA in the vicinity of the Mars Polar Lander landing site. Blue tones represent elevations of less than 2 kilometers, while reddish tones are greater than about 2.8 kilometers, relative to the mean equatorial height of Mars. The elevation of the landing site is about 2.4 km, midway into the polar layered terrain. The 400 meters (¼ mile) resolution of the MOLA data gives a smoothed but vertically exaggerated view of the topography. At this scale it is impossible to ascertain the actual roughness at the lander's destination, forcing project directors to make their best guesses based on available data.
A rotating view of the Martian south pole using MOLA topography data

The visible Martian south polar cap appears outlined in black, but the accompanying false color data shows the topographically inferred extent of the polar layered terrain.
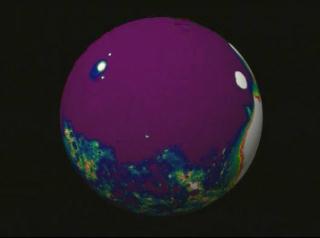
False color image of Mars from MOLA data. Here the color scale shows the darkest blues as roughly 8 km below the mean equatorial height, while reds indicate elevations up to 5 km above the mean equatorial height.
MOLA data of Martian topography highlighting the differences in elevation between the Hellas Impact Basin and surrounding terrain. The deepest point in Hellas is roughly 8200 meters below the equatorial mean.
For More Information
Credits
Please give credit for this item to:
NASA/Goddard Space Flight Center
Scientific Visualization Studio
-
Animator
- Tom Biddlecome (Raytheon)
-
Scientist
- David Smith (NASA/GSFC)
Release date
This page was originally published on Monday, November 22, 1999.
This page was last updated on Wednesday, May 3, 2023 at 1:58 PM EDT.
Missions
This visualization is related to the following missions:Series
This visualization can be found in the following series:Datasets used in this visualization
-
Topography [MGS: MOLA]
ID: 352
Note: While we identify the data sets used in these visualizations, we do not store any further details, nor the data sets themselves on our site.
Alternate Versions
- ID: 769
 Visualization
 - ID: 771
Used as a Source In
- ID: 14261
 Produced Video