A Comparison of Visible and Topographic Data for the Martian South Pole: Version 2
This is one of a series of visualizations showing false-colored renderings of the Martian topography measured by MOLA in the vicinity of the Mars Polar Lander landing site. Blue tones represent elevations of less than 2 kilometers, while reddish tones are greater than about 2.8 kilometers, relative to the mean equatorial height of Mars. The elevation of the landing site is about 2.4 km, midway into the polar layered terrain. The 400 meters (¼ mile) resolution of the MOLA data gives a smoothed but vertically exaggerated view of the topography. At this scale it is impossible to ascertain the actual roughness at the lander's destination, forcing project directors to make their best guesses based on available data.
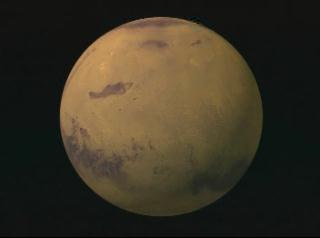
Rotating a Martian globe, using Viking imagery, to the south pole and fading to topography data from MOLA, showing that large portions of the ice cap may be covered by dust. Note that the permanent frozen cap of carbon dioxide ice is not located directly at the south pole. White colors indicate elevations in excess of 3012 meters, and dark violet shows elevations from 320 to 2150 meters.

A visible image of the Martian south pole, from Viking data, overlaid over a false color image of the topography of the region as measured by MOLA
For More Information
Credits
Please give credit for this item to:
NASA/Goddard Space Flight Center
Scientific Visualization Studio
-
Animators
- Tom Biddlecome (Raytheon)
- Greg Shirah (NASA/GSFC)
-
Scientist
- David Smith (NASA/GSFC)
Release date
This page was originally published on Monday, November 22, 1999.
This page was last updated on Wednesday, May 3, 2023 at 1:58 PM EDT.
Missions
This visualization is related to the following missions:Series
This visualization can be found in the following series:Datasets used in this visualization
-
[Viking]
ID: 130 -
Topography [MGS: MOLA]
ID: 352
Note: While we identify the data sets used in these visualizations, we do not store any further details, nor the data sets themselves on our site.
Alternate Versions
- ID: 767