2023 Atlantic Hurricane Season
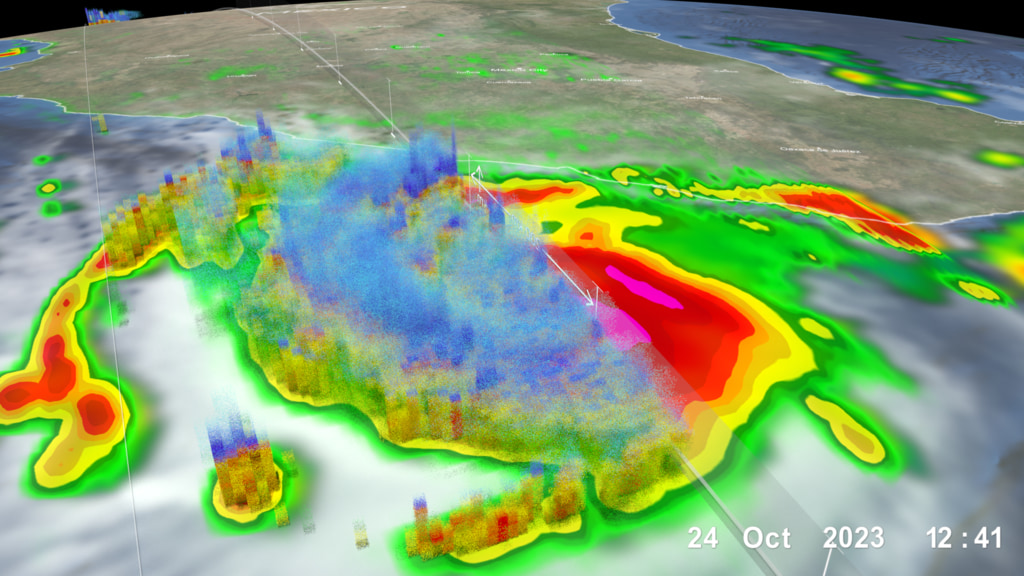
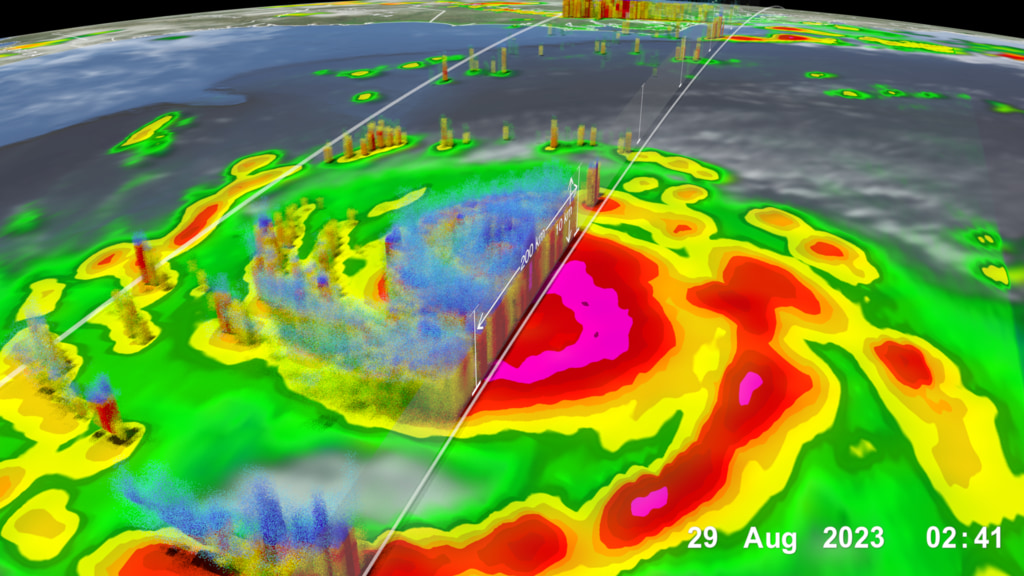
The 2023 Atlantic Hurricane Season from June 1st through October 31st. The colors over the ocean are Sea Surface Temperatures where reds are high temperatures and blues are low. The colors underneath the clouds are precipitation measurements, where red is high and greens are low. Each hurricane name tracks with it's corresponding storm and leaves behind category designations (TD=Tropical Depression; TS=Tropical Storm; and 1 through 5 are hurricane strengths) as each storm increases and decreases in strength.
Throughout the 2023 hurricane season, NASA observed elevated sea surface temperatures (SSTs) in key regions such as the Atlantic Ocean and the Gulf of Mexico. These warmer waters provided more energy for storm formation and intensification.
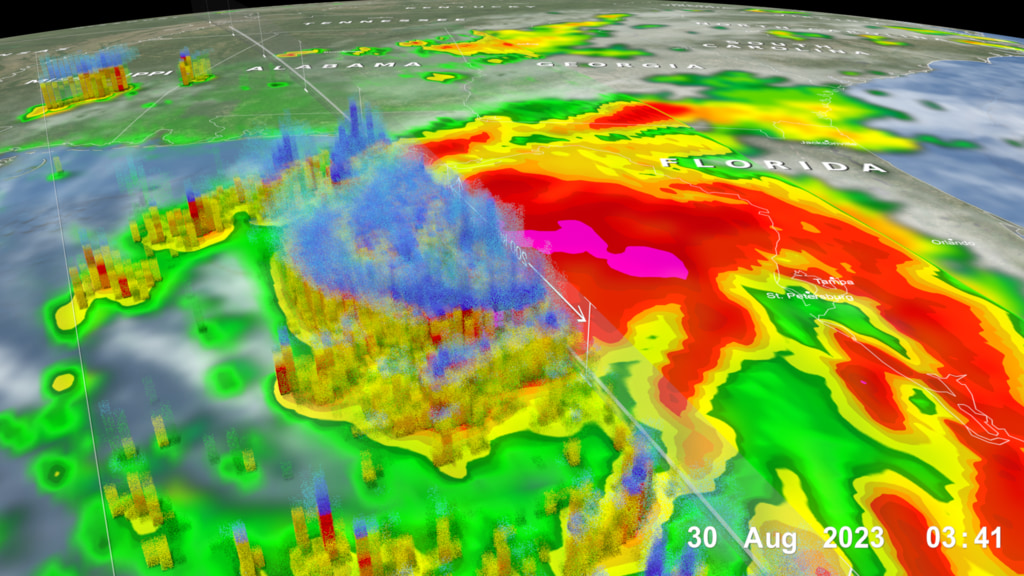
NASA's IMERG data product enabled precise tracking of precipitation rates associated with these hurricanes. The 2023 season saw significant precipitation, with several storms producing record-breaking rainfall. This was particularly evident in hurricanes that made landfall, where the combination of slow-moving systems and ample moisture led to severe flooding in affected areas.
The 2023 hurricane season featured a range of storms, from tropical storms to major hurricanes (Category 3 and above). Notably, there was an above-average number of major hurricanes, reflecting the influence of higher SSTs and favorable atmospheric conditions. NASA's monitoring systems tracked the progression of these hurricanes, providing real-time data on their intensity and potential impacts. The season included several high-impact hurricanes that reached Category 4 and Category 5 status, causing widespread damage in their paths.
The data collected by NASA during the 2023 hurricane season underscored the significant role of environmental factors, such as SSTs and atmospheric moisture, in shaping hurricane activity. The increased frequency and intensity of storms highlighted the importance of continued monitoring and research to better understand and predict future hurricane seasons in the context of a changing climate.
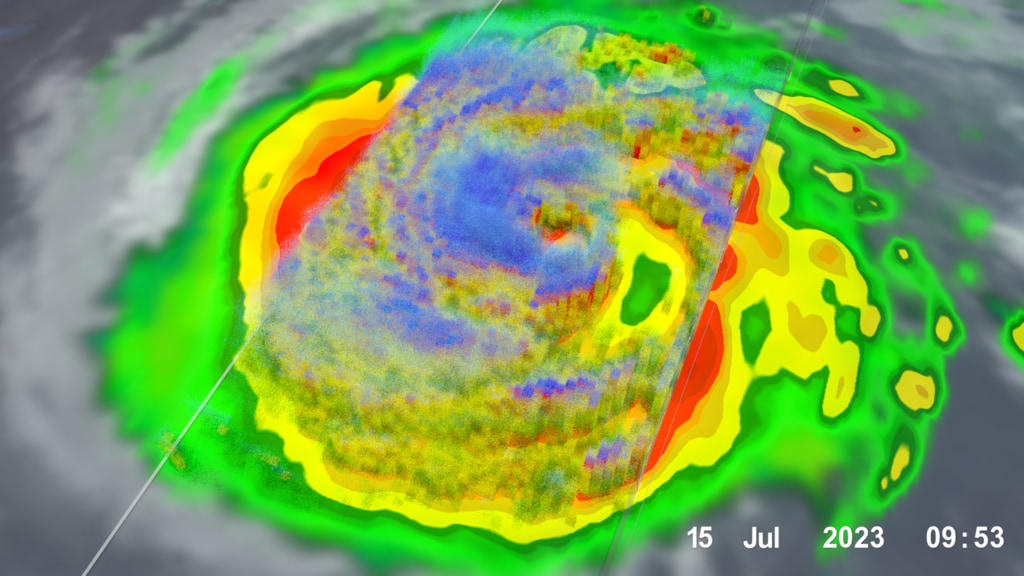
Same as above, but only shows the hurricane tracks with the Sea Surface Temperature (SST) data. When viewed this way, one can more easily see how strong (Category 1 and higher) hurricanes can absorb the heat from the SST and leave a slightly cooler trail after they pass. This phenomenon can most easily be seen with Hurricane Franklin as it carves an orange trail through the red SSTs of the Atlantic.
Same as the topmost video except only showing hurricane tracks and GPM IMERG precipitation measurements. When observing the data this way, one can more easily see that the majority of the rainfall tends to occur on the righthand side of most Atlantic hurricanes.
Same as topmost animation, but only showing hurricane tracks and clouds. This is a more traditional view of hurricanes that most of us are used to seeing. Just watching the clouds can also more easily show the counter-clockwise circulation of Atlantic hurricanes.
. Shades of green represent low amounts of liquid precipitation, whereas shades of red represent high amounts of precipitation.")
Color bar for liquid precipitation rates (ie, rain rates). Shades of green represent low amounts of liquid precipitation, whereas shades of red represent high amounts of precipitation.
Color bar for frozen precipitation rates (ie, snow rates). Shades of cyan represent low amounts of frozen precipitation, whereas shades of purple represent high amounts of precipitation.
Sea Surface Temperature (SST) colorbar focusing primarily on temperatures between 20 degrees Celsius to 30 Celsius. Hurricanes tend to form over the warm tropical oceans where the SST is warmer than ~26.5 C (~80 F) depicted in colors from yellow to red.
Credits
Please give credit for this item to:
NASA/Goddard Space Flight Center Scientific Visualization Studio
Additional credits:
Storm tracks and strengths courtesy of NOAA's National Weather Service.
Blue Marble MODIS data composite courtesy of the MODIS Science Team NASA Goddard Space Flight Center and the NASA Earth Observatory.
Data visualizers
- Alex Kekesi (Global Science and Technology, Inc.)
- Greg Shirah (NASA/GSFC)
- Kel Elkins (USRA)
- A. J. Christensen (AVL NCSA/University of Illinois)
- Cindy Starr (Global Science and Technology, Inc.)
Data provider
- Alex Gurvich (NASA/GSFC)
Technical support
- Laurence Schuler (ADNET Systems, Inc.)
- Ian Jones (ADNET Systems, Inc.)
Release date
This page was originally published on Tuesday, July 2, 2024.
This page was last updated on Friday, June 28, 2024 at 1:26 PM EDT.
Series
This visualization can be found in the following series:Datasets used in this visualization
CPC (Climate Prediction Center) Cloud Composite
ID: 600Global cloud cover from multiple satellites
See all pages that use this datasetMUR SST (Multi-scale Ultra-high Resolution (MUR) Sea Surface Temperature (SST) Analysis)
ID: 845IMERG
ID: 863This dataset can be found at: http://pmm.nasa.gov/sites/default/files/document_files/IMERG_ATBD_V4.4.pdf
See all pages that use this datasetHurricane Tracks (Automated Tropical Cyclone Forecast (ATCF) - Best Track)
ID: 1109Credit: NOAA
This dataset can be found at: https://ftp.nhc.noaa.gov/atcf/
See all pages that use this dataset
Note: While we identify the data sets used in these visualizations, we do not store any further details, nor the data sets themselves on our site.
Related
- ID: 5181
- ID: 5145
 Visualization
 - ID: 5146
- ID: 5129
 Visualization