Our Active Ionosphere
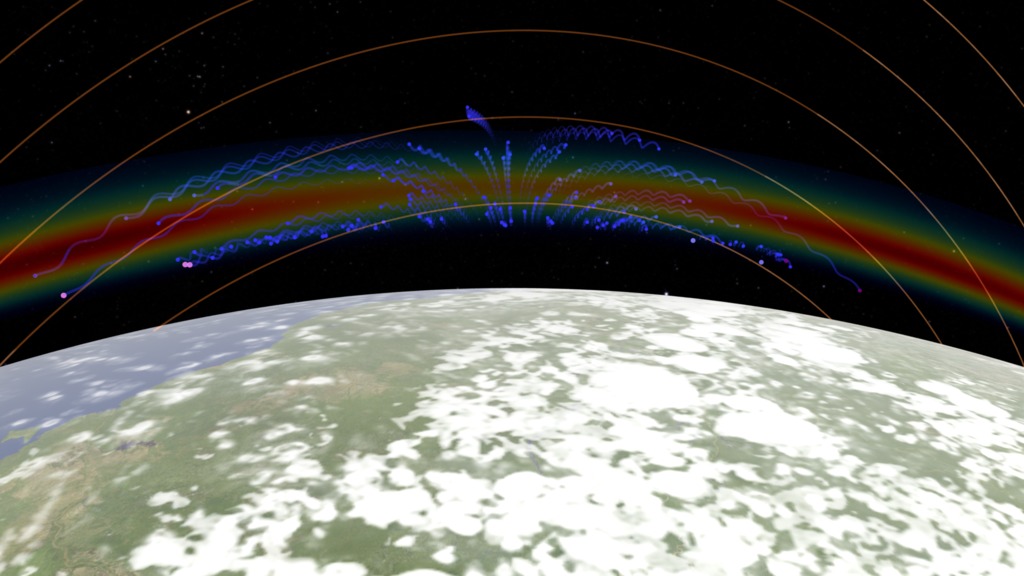
In this view of Earth on October 7, 2019, just past sunset, GOLD observed an X-shaped structure in the equatorial ionization anomaly.
Charged particles in Earth's upper atmosphere are formed when ultraviolet radiation from the Sun ionizes atoms and molecules in the atmosphere by knocking out electrons. In combination with Earth's intrinsic geomagnetic field, the electromagnetic interaction of this ionized plasma can form large-scale structures such as the equatorial ionization anomaly (Interface to Space: The Equatorial Fountain). The upper atmosphere, once energized by exposure to ultraviolet light during the day, can re-emit some of this energy after sunset.
Other events, such as geomagnetic storms applying forces from above and terrestrial weather applying forces from below, can drive smaller scale variations within the ionosphere. These can result in the formation of “bubbles” of lower ultraviolet emission and “X” features depicted here.
While these features have been observed before, NASA’s Global-scale Observations of the Limb and Disk (GOLD) mission has provided more complete coverage of these regions, allowing us to see more variations. This is important because variations in the ionosphere affect signals traveling between the ground and satellites, like radio communications and global positioning systems.
A 'Rayleigh' is a unit of measure suitable for low light intensities, such as the night sky and aurora.
In this close-up view of Earth on October 7, 2019, just after sunset, GOLD observed an X-shaped structure in the oxygen emission of the equatorial ionization anomaly.
Facing C-shaped, or '( )', bubbles in the oxygen emission of the equatorial ionization anomaly, as seen by GOLD on October 12, 2020.
Closeup view of facing C-shaped, or '( )', bubbles in the oxygen emission of the equatorial ionization anomaly, as seen by GOLD on October 12, 2020.
Back-to-back C-shaped, or ') (', bubbles in the oxygen emission of the equatorial ionization anomaly, as seen by GOLD on December 26, 2021.
Close-up view of back-to-back 'C-shaped, or ') (', bubbles in the oxygen emission of the equatorial ionization anomaly, as seen by GOLD on December 26, 2021.
Comparing and contrasting the different shapes of ionospheric bubbles in oxygen emission from the equatorial ionization anomaly. In this case '( )' bubbles vs ') (' bubbles.
Close-up view comparing and contrasting the different shapes of ionospheric bubbles in oxygen emission from the equatorial anomaly. In this case '( )' bubbles vs ') (' bubbles.
For More Information
See NASA.gov
Credits
Please give credit for this item to:
NASA's Scientific Visualization Studio
Visualizer
- Tom Bridgman (Global Science and Technology, Inc.)
Scientist
Writers
- Vanessa Thomas (KBR Wyle Services, LLC)
- Miles S. Hatfield (Telophase)
- Rachel Lense (ADNET Systems, Inc.)
Technical support
- Laurence Schuler (ADNET Systems, Inc.)
- Ian Jones (ADNET Systems, Inc.)
Release date
This page was originally published on Thursday, June 27, 2024.
This page was last updated on Tuesday, June 25, 2024 at 9:02 AM EDT.
Missions
This visualization is related to the following missions:Series
This visualization can be found in the following series:Datasets used in this visualization
[SES 14: GOLD]
ID: 1049Global-scale Observations of the Limb and Disk (GOLD) is an ultraviolet imaging spectrograph to measure temperatures and densities in the Earth's thermosphere & ionosphere.
See all pages that use this dataset
Note: While we identify the data sets used in these visualizations, we do not store any further details, nor the data sets themselves on our site.
Related
- ID: 4617
 Visualization