Sea Surface Temperature (SST) Anomaly - Near Real Time
An equirectangular view of sea surface temperature (SST) anomaly data for the past two and half years, updated daily to include the latest available data.
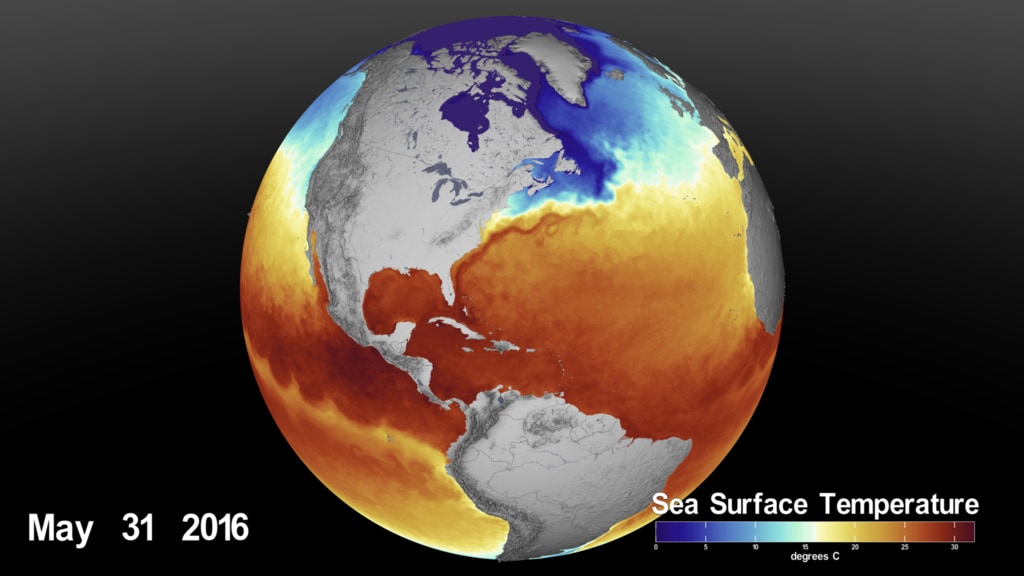
This visualization shows Sea Surface Temperature (SST) Anomaly data from the Jet Propulsion Laboratory (JPL) Multi-scale Ultra-high Resolution (MUR) Sea Surface Temperature Analysis. The analysis data is near-real-time (one day latency) and the visualization is updated daily to include the latest available data.
Data available here: https://podaac.jpl.nasa.gov/dataset/MUR-JPL-L4-GLOB-v4.1

Still image of the most recent sea surface temperature (SST) anomaly data available. Equirectangular view.
An equirectangular view of sea surface temperature (SST) anomaly data for the past two and half years, updated daily to include the latest available data. This version is centered on the Pacific.
Still image of the most recent sea surface temperature (SST) anomaly data available. Equirectangular view. This version is centered on the Pacific Ocean.
An equirectangular view of the most recent sea surface temperature (SST) anomaly data available (still image). This version has no datestamp.
Still image of the most recent sea surface temperature (SST) anomaly data available. Equirectangular view. This version has no datestamp.
A view of sea surface temperature (SST) anomaly data for the past two and half years, updated daily to include the latest available data. This version is a robinson projection.
Still image of the most recent sea surface temperature (SST) anomaly data available. Robinson projection.
This is the colorbar for SeaSurface Temperature (SST) anomaly data shown above. The color shading changes from blue - white - red. And the color range is -4 to 4 with the unit of degrees Celsius.
Credits
Please give credit for this item to:
NASA's Scientific Visualization Studio
-
Visualizer
- Kel Elkins (USRA)
-
Technical support
- Laurence Schuler (ADNET Systems, Inc.)
- Ian Jones (ADNET Systems, Inc.)
-
Scientist
- Atousa Saberi (NASA/GSFC)
Release date
This page was originally published on Monday, October 16, 2023.
This page was last updated on Friday, May 3, 2024 at 8:46 PM EDT.
Datasets used in this visualization
-
MUR SST (Multi-scale Ultra-high Resolution (MUR) Sea Surface Temperature (SST) Analysis)
ID: 845
Note: While we identify the data sets used in these visualizations, we do not store any further details, nor the data sets themselves on our site.
Related
- ID: 4809