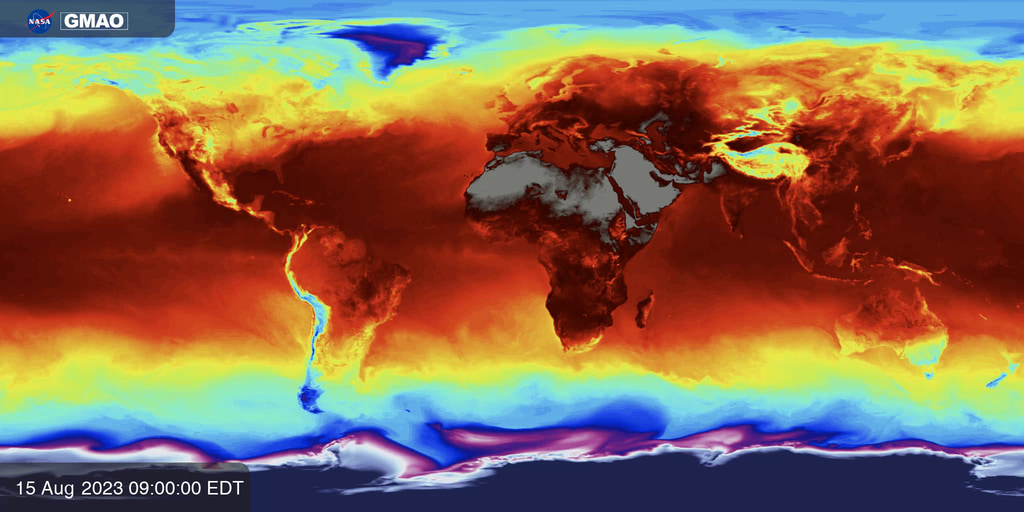
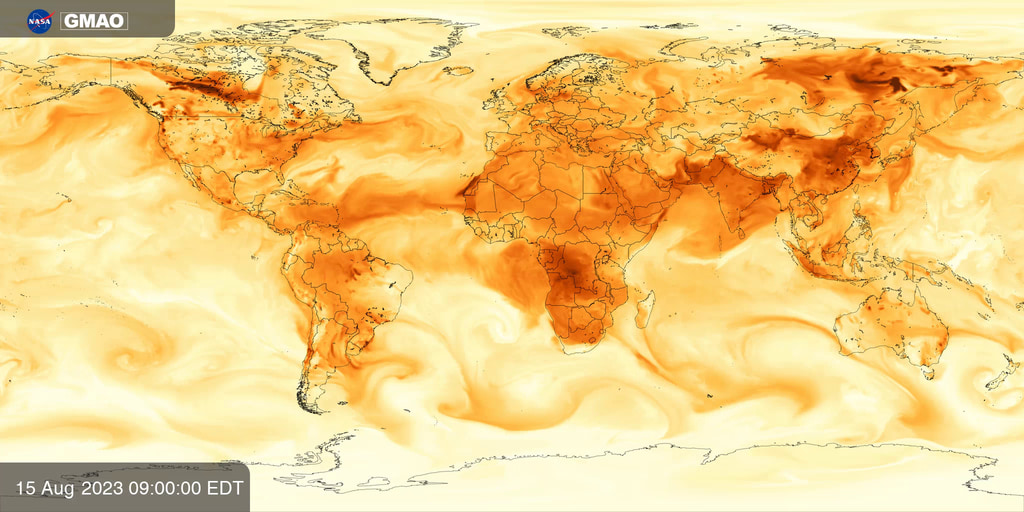
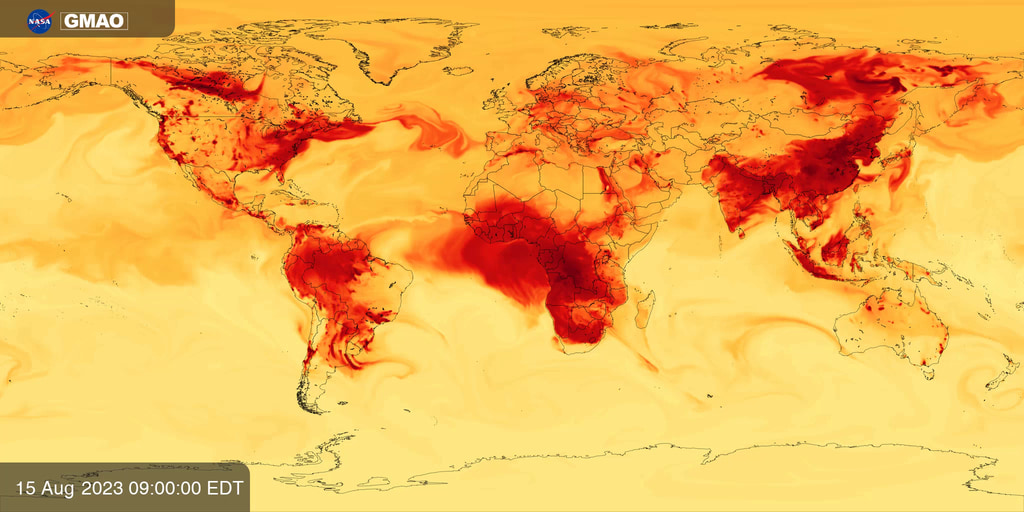
Near surface Ozone (O3)
Near surface concentration of ozone (O3) estimated by NASA’s GEOS-CF model.
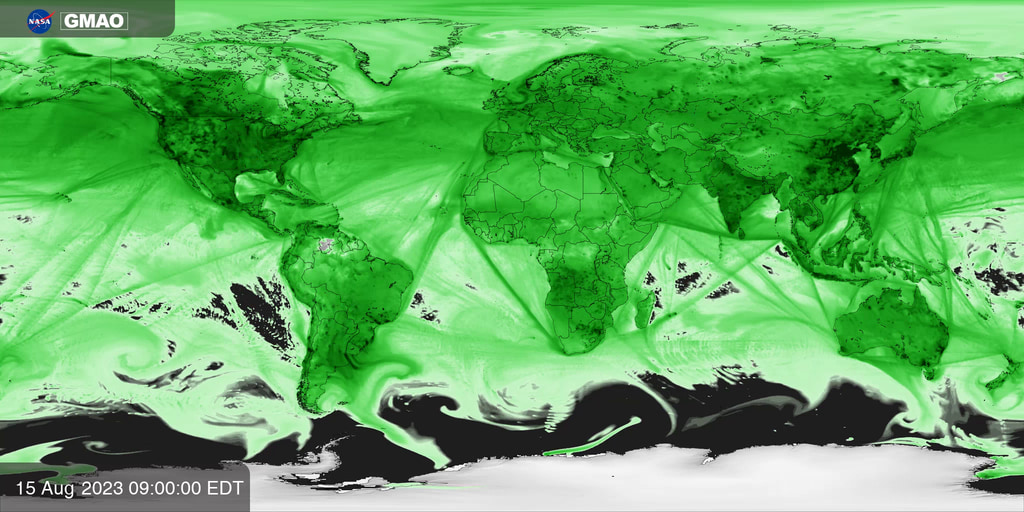
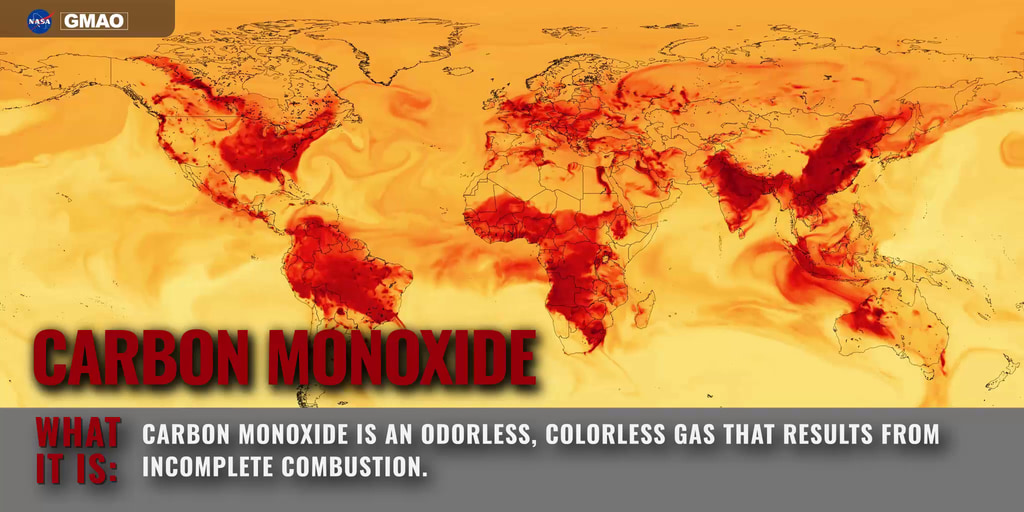
Predictions of air pollution are created using complex models that combine information about weather and the emissions, transformation, and transport of chemical species and particles. The Goddard Earth Observing System Composition Forecasting (GEOS-CF) system is a research model maintained by NASA’s Global Modeling and Assimilation Office to help scientists understand the causes and impact of air pollution. It is one of the highest resolution and most detailed models of its kind in the world, made possible through ongoing collaborations between NASA and university scientists. GEOS-CF tracks the concentrations of hundreds of gas phase chemical species and dozens of types of particles characterized by their composition and size. It is used by a wide variety of stakeholders around the world to develop new methods for improving local predictions, understanding the impact of pollution on human health, and improving the quality of NASA satellite datasets.
Ozone, a molecule comprised of three oxygen atoms, is critically important to Earth’s atmosphere. Many miles above the surface, it absorbs harmful ultraviolet radiation, helping make the planet habitable for humans. However, at the nose level it is known for its harmful human health effects, contributing to chest pain and congestion and worsening conditions liken asthma and bronchitis. It can also damage plants and is estimated to result in millions of dollars in crop losses every year. Estimating near surface ozone concentrations is extremely complex because ozone is not directly emitted, but forms as a byproduct of nitrogen oxides and volatile organic compounds in the presence of sunlight. Ozone concentrations vary substantially during day and night, peaking mid-day after morning rush hour peaks in precursor concentrations. Concentrations drop after sunset as ozone is lost through a series of chemical reactions, but are replenished in polluted regions the following day.
Credits
Please give credit for this item to:
NASA’s Global Modeling and Assimilation Office
-
Visualizer
- Joseph V. Ardizzone (NASA/GSFC)
Release date
This page was originally published on Tuesday, September 26, 2023.
This page was last updated on Tuesday, May 7, 2024 at 11:01 PM EDT.
Papers used in this visualization
Keller, C. A., Knowland, K. E., Duncan, B. N., Liu, J., Anderson, D. C., Das, S., Lucchesi, R. A., Lundgren, E. W., Nicely, J. M., Nielsen, E., Ott, L. E., Saunders, E., Strode, S. A., Wales, P. A., Jacob. D. J., and Pawson, S. (2021). Description of the NASA GEOS composition forecast modeling system GEOS-CF v1.0. Journal of Advances in Modeling Earth Systems, 13, e2020MS002413. https://doi.org/10.1029/2020MS002413
Keller, C. A., Knowland, K. E., Duncan, B. N., Liu, J., Anderson, D. C., Das, S., Lucchesi, R. A., Lundgren, E. W., Nicely, J. M., Nielsen, E., Ott, L. E., Saunders, E., Strode, S. A., Wales, P. A., Jacob. D. J., and Pawson, S. (2021). Description of the NASA GEOS composition forecast modeling system GEOS-CF v1.0. Journal of Advances in Modeling Earth Systems, 13, e2020MS002413. https://doi.org/10.1029/2020MS002413
Datasets used in this visualization
-
GEOS-CF
ID: 1197Knowland, K.E., C.A. Keller, and R. Lucchesi, 2022: File Specification for GEOS-CF Products. GMAO Office Note No. 17 (Version 1.3), 54 pp, available from https://gmao.gsfc.nasa.gov/pubs/docs/Knowland1446.pdf
This dataset can be found at: https://gmao.gsfc.nasa.gov/weather_prediction/GEOS-CF/data_access/
See all pages that use this dataset
Note: While we identify the data sets used in these visualizations, we do not store any further details, nor the data sets themselves on our site.
Related
- ID: 5147
 Visualization
 - ID: 5148
 Visualization
 - ID: 5149
 Visualization
 - ID: 5150
 Visualization
 - ID: 5151
 Visualization
 - ID: 5153
 Visualization
 - ID: 5154
 Visualization
Used as a Source In
- ID: 14439
 Produced Video