Asteroid Bennu 3D Models
These 3D models and images were created using data from NASA’s OSIRIS-REx spacecraft collected while in orbit around asteroid Bennu. These are some of the 3D models that were used to create several SVS Bennu data visualizations, including Tour of Asteroid Bennu, Detailed Global Views of Asteroid Bennu, and Bennu TAG Surface Change.

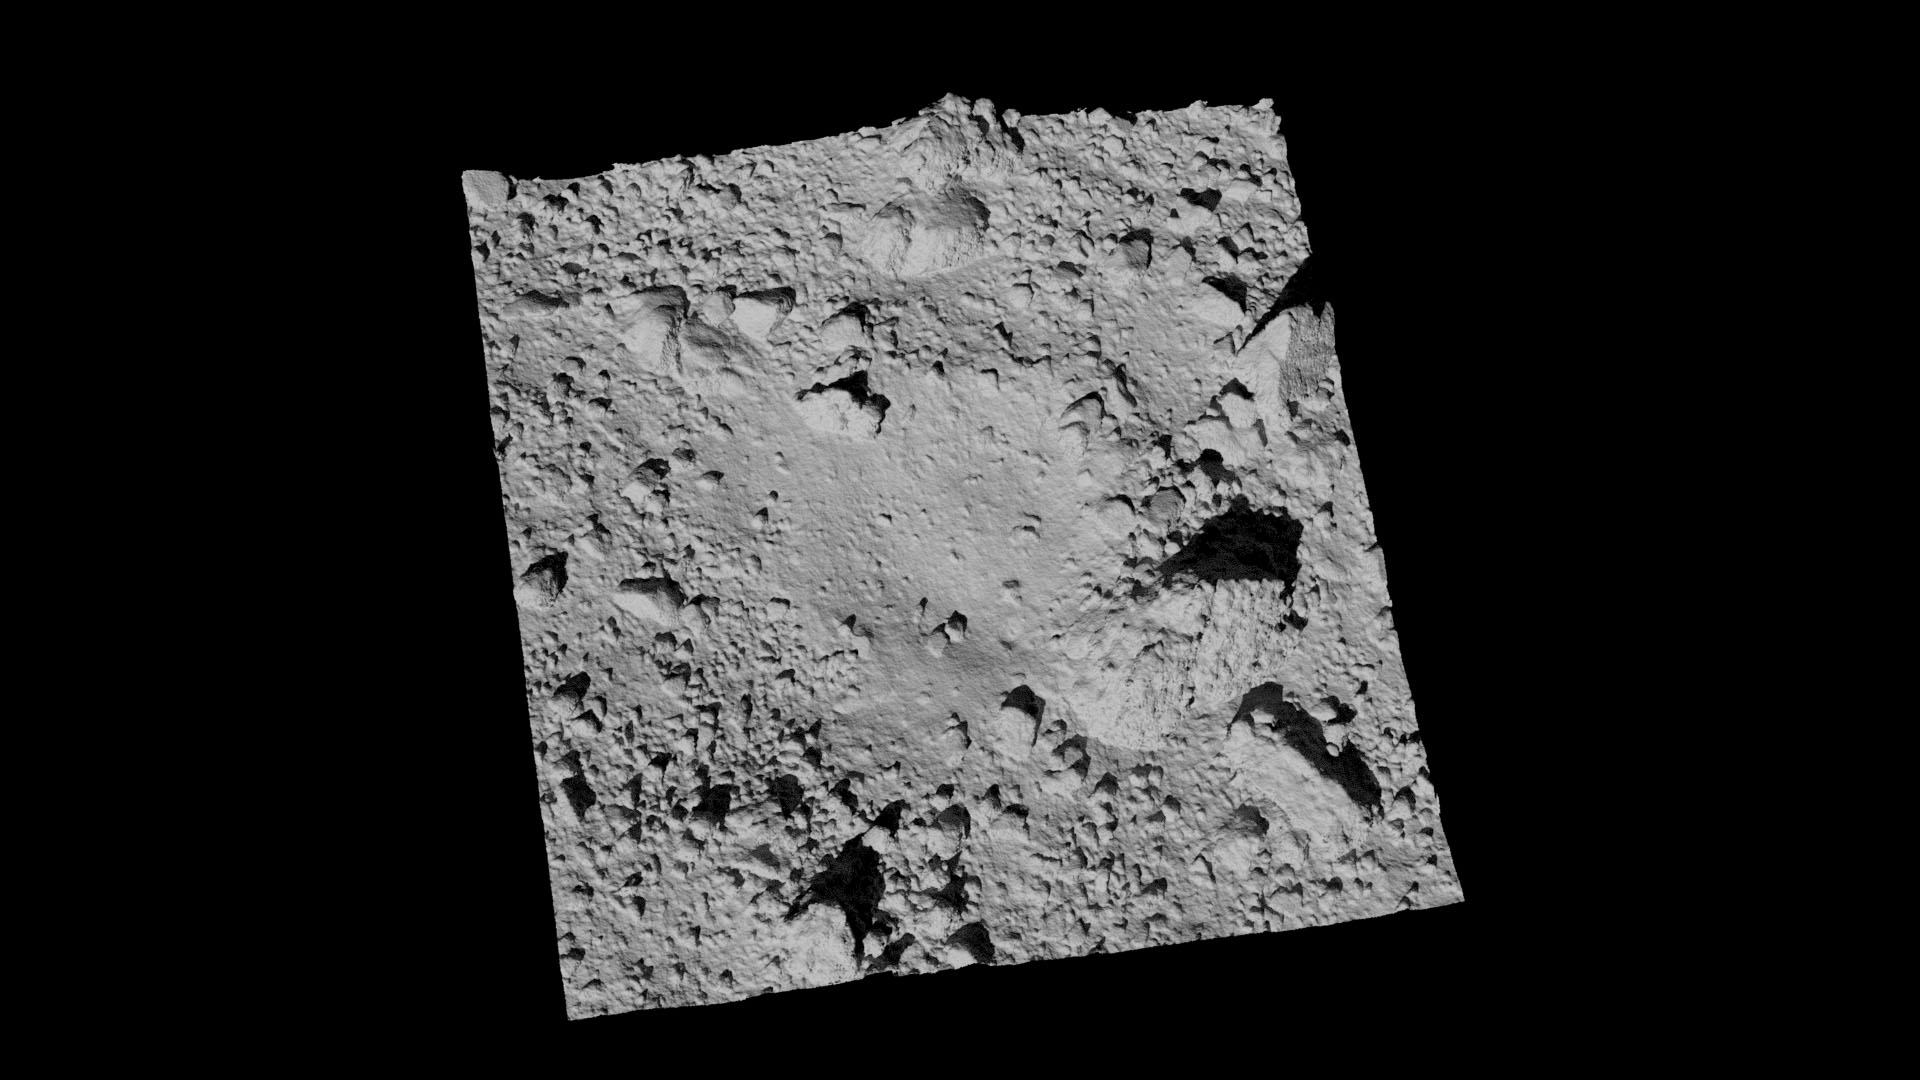
Global Bennu 3D model - OLA v21 PTM - 17.9M polygons
This model was used in and described by Seabrook et al. (2022). This model used a Poisson reconstruction method (Kazhdan et al., 2020), a technique that better captures the undersides and complex geometries of boulders on Bennu.
This model is available in OBJ and glTF (glb) formats. Right click the desired format link below and select “Save Link As…” to download the model.
OBJ (815.9 MB)
GLB (321.6 MB)
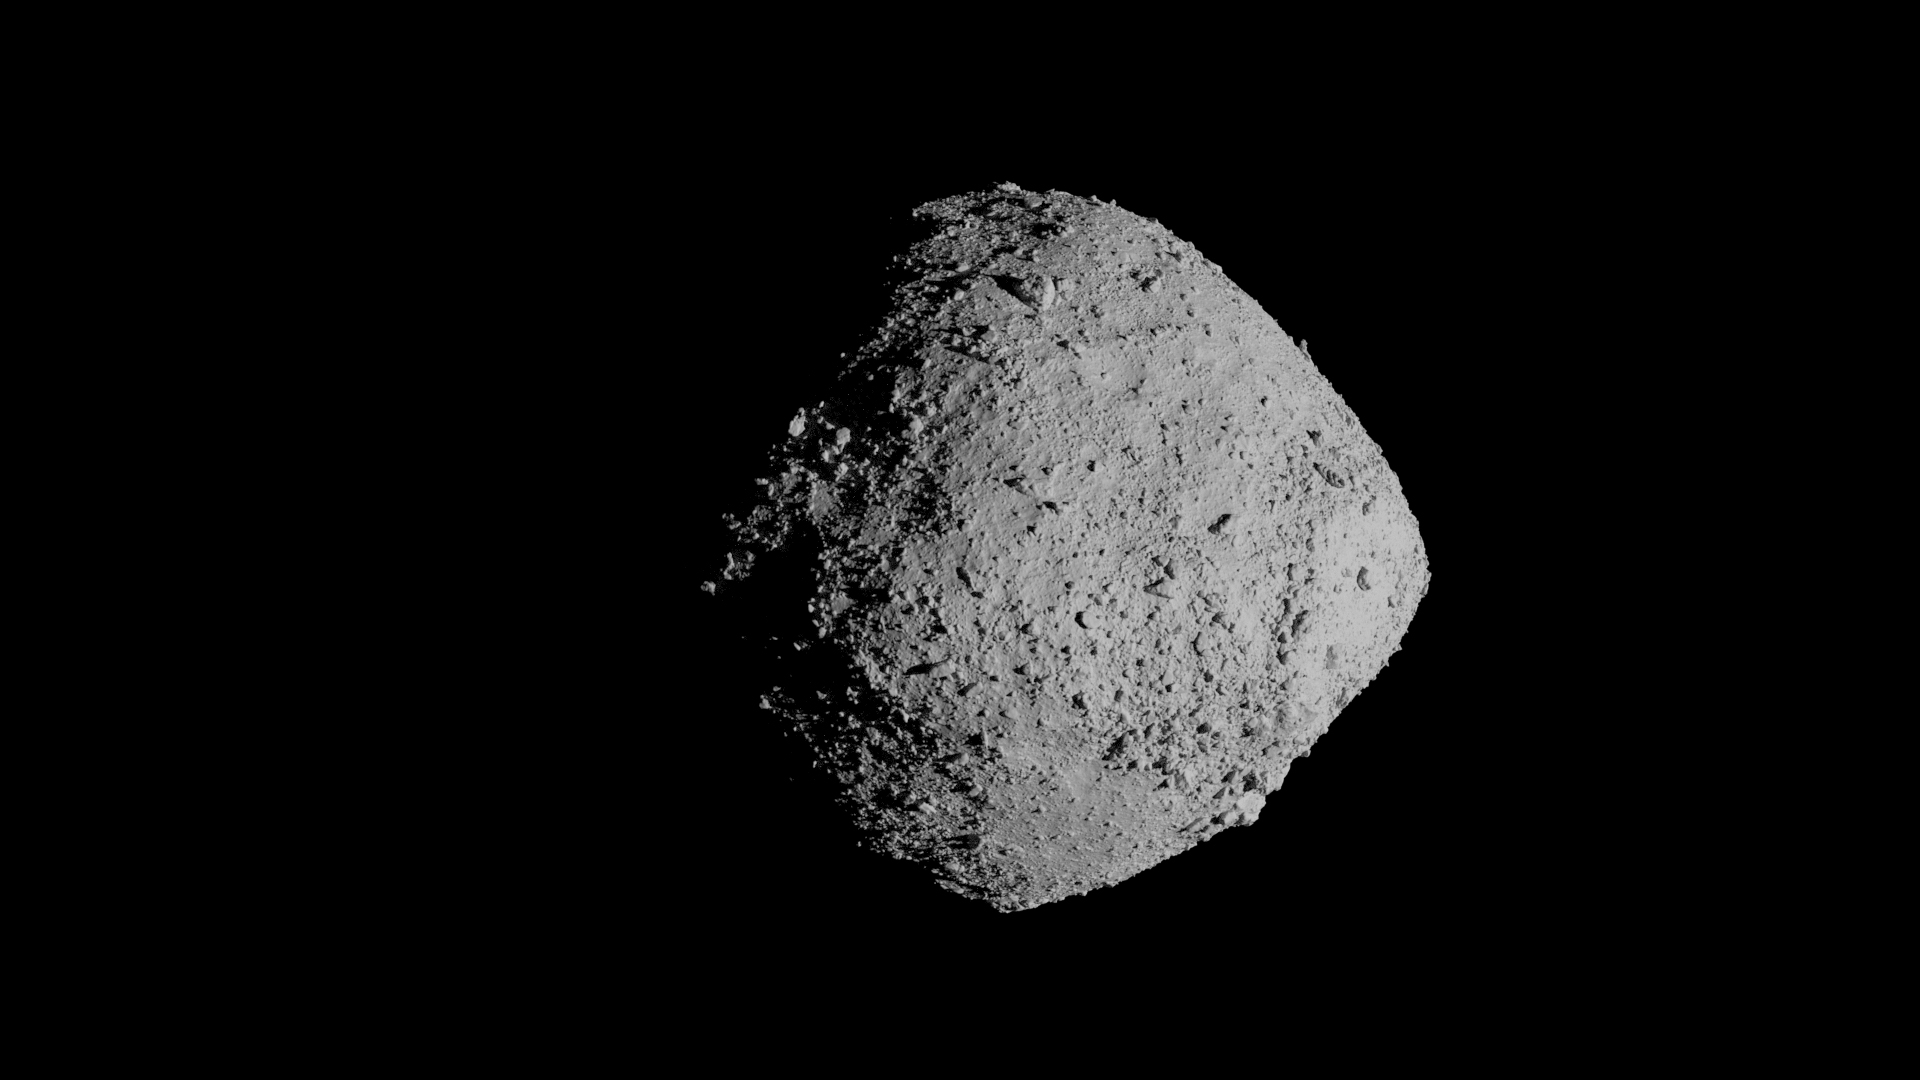
This preview image shows the Bennu global 3D model (OLA v21 PTM) lit from the side.
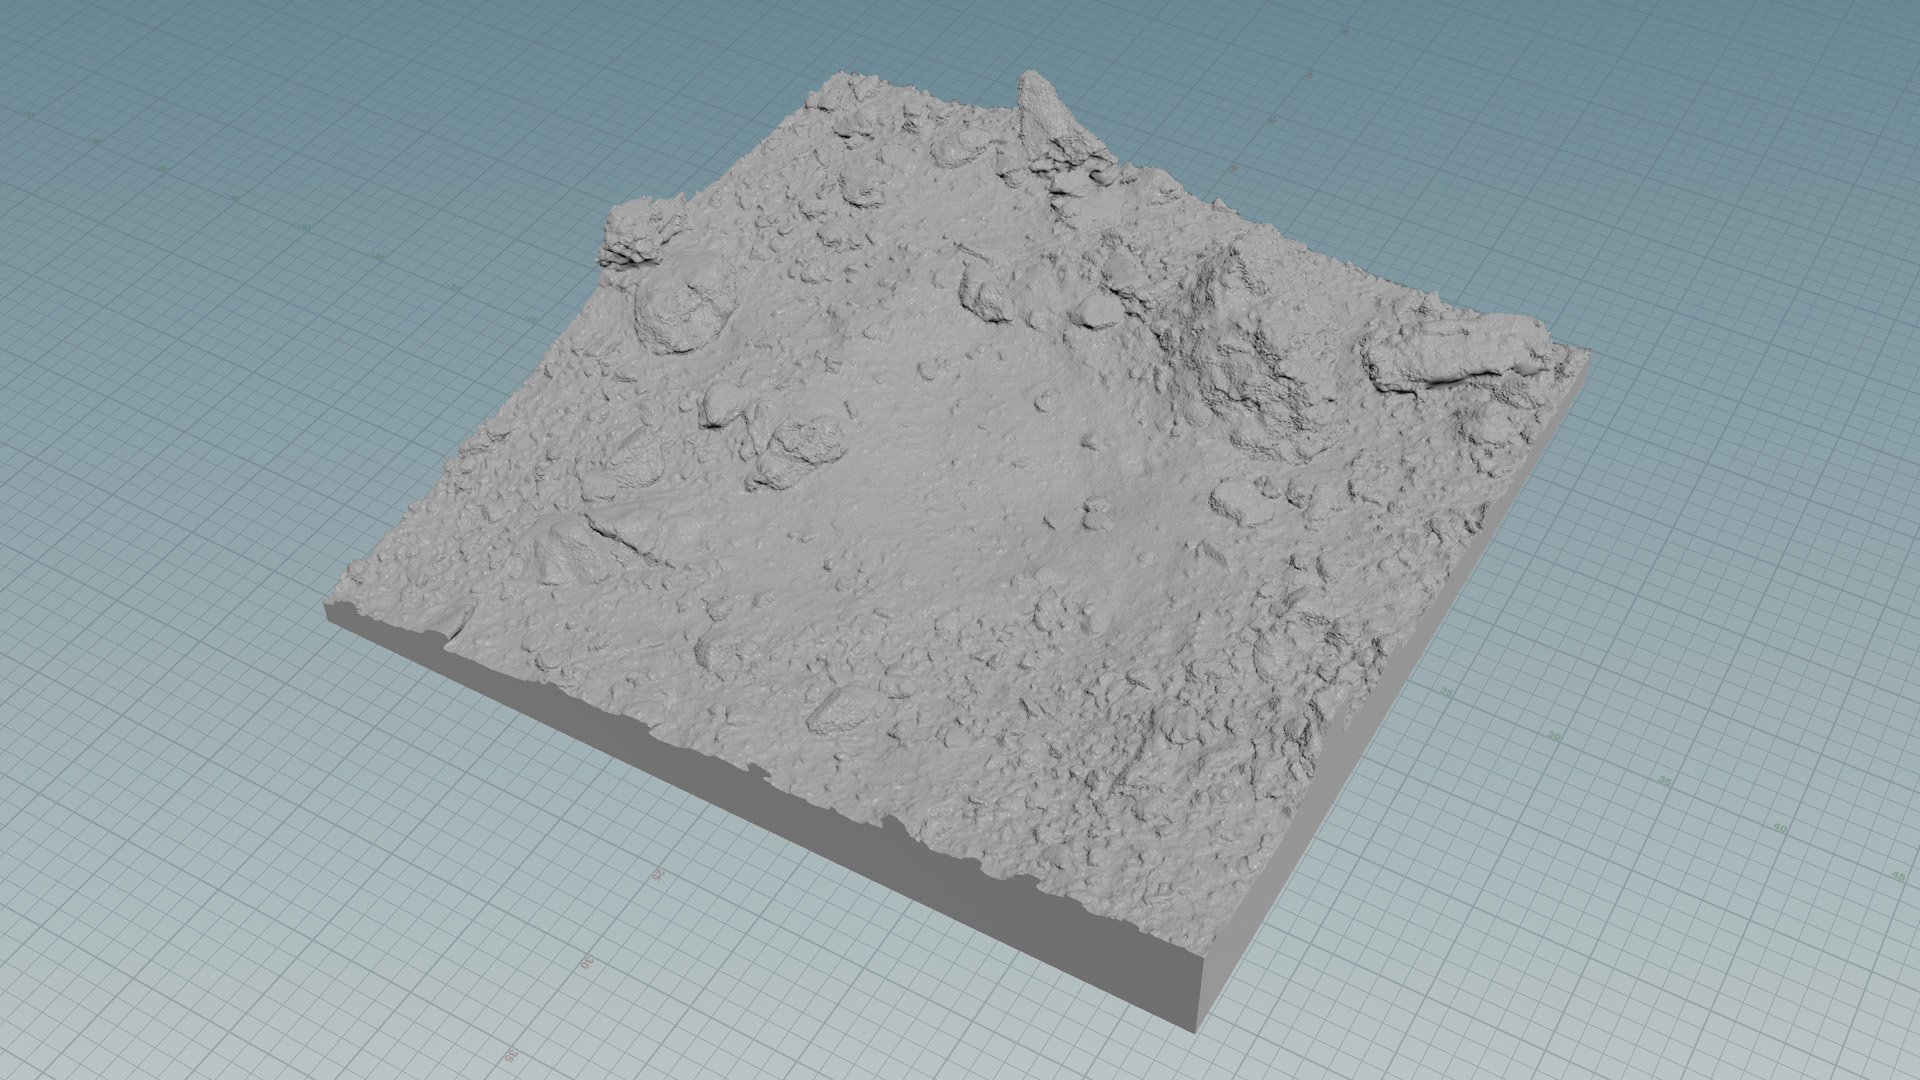
Global Bennu 3D model - OLA v20 PTM - 3.4M polygons
This model was used in and described by Daly et al. (2020). This model used a Poisson reconstruction method (Kazhdan et al., 2020), a technique that better captures the undersides and complex geometries of boulders on Bennu.
This model is available in OBJ and glTF (glb) formats. Right click the desired format link below and select “Save Link As…” to download the model.
OBJ (195.3 MB)
GLB (60.6 MB)
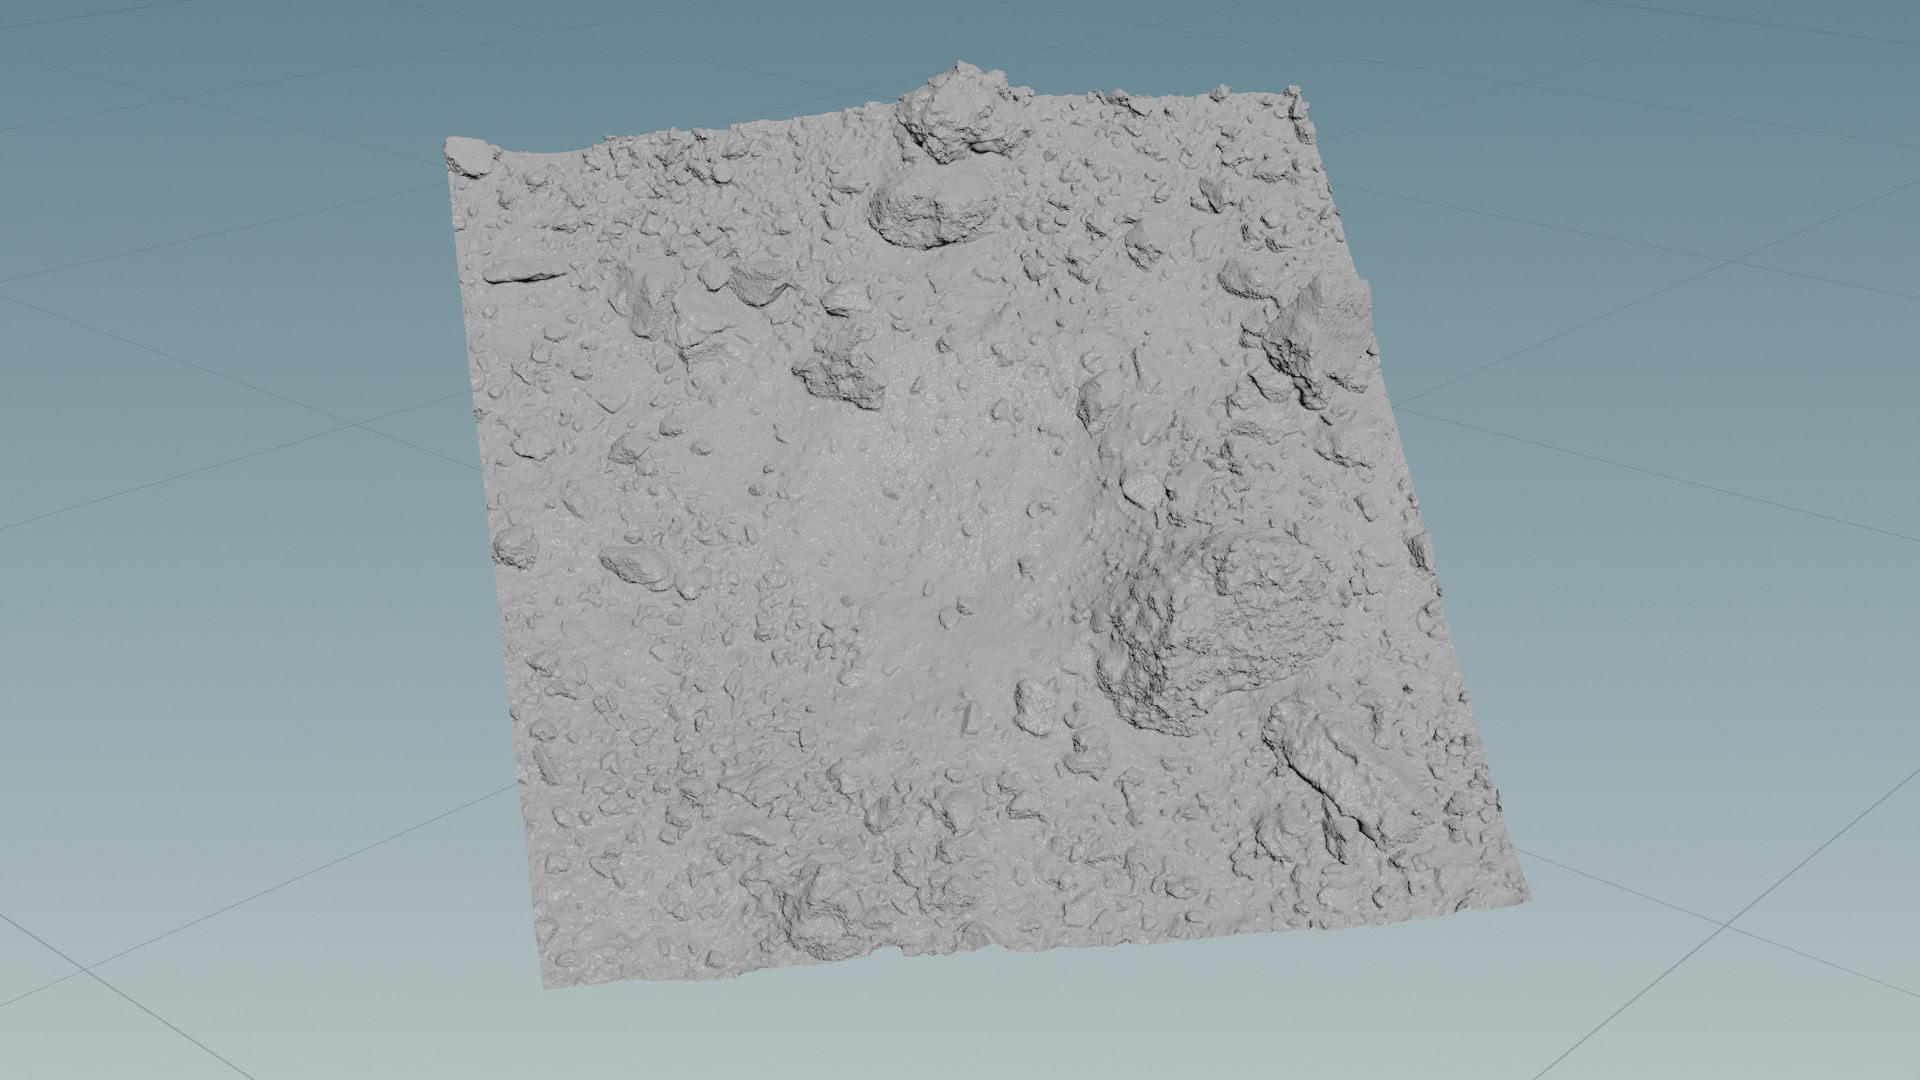
Additional 3D models are available from the JHUAPL Small Body Mapping Tool (SBMT). The full collection of models includes 5cm resolution tiles for the entire asteroid (only the sample site tile is posted here due to storage limitations).
This global map of asteroid Bennu’s surface is a mosaic of images collected by NASA’s OSIRIS-REx spacecraft between Mar. 7 and Apr. 19, 2019. A total of 2,155 PolyCam images were stitched together and corrected to produce the mosaic. At 2 inches (5 cm) per pixel, this is the highest resolution at which a planetary body has been globally mapped. The spacecraft collected these images at distances ranging from 1.9 to 3.1 miles (3.1 to 5 km) above the asteroid’s surface. Details for the creation of the basemap can be found in “A high-resolution global Basemap of (101955) Bennu” by Bennett et al. Icarus (2020).
The Bennu albedo map was generated using images acquired by PolyCam during Baseball Diamond Flyby 1. The images were photometrically normalized to represent the innate albedo of Bennu’s surface. Details for the creation of the map can be found in the publication “A High-Resolution Normal Albedo Map of Asteroid (101955) Bennu” by Golish et al. Icarus (2020).
Polar regions that were not imaged in Flyby 1 are visualized using the Bennu global basemap, created from PolyCam images acquired during Baseball Diamond Flybys 3 and 4.
In our SVS Bennu visualizations, we mapped the two images above to the 3D models with a spherical UV mapping projection (which uses a projection that is based on a spherical shape wrapped around the mesh). Images were blended to achieve the highest resolution texture while still ensuring global coverage. The albedo map above was used as the top texture layer while the global image mosaic was placed underneath to fill the polar regions.
The next two models are versions of the 5cm resolution sample site tile that have been prepared for 3D printing (added thickness, centered, and adjusted scale). The ‘After TAG’ model was created by offsetting the ‘Before TAG’ mesh vertices using pre-post TAG surface height change data. This offset is only applied to the region within 7.5 meters of the impact site, as the data are less accurate further from the impact.
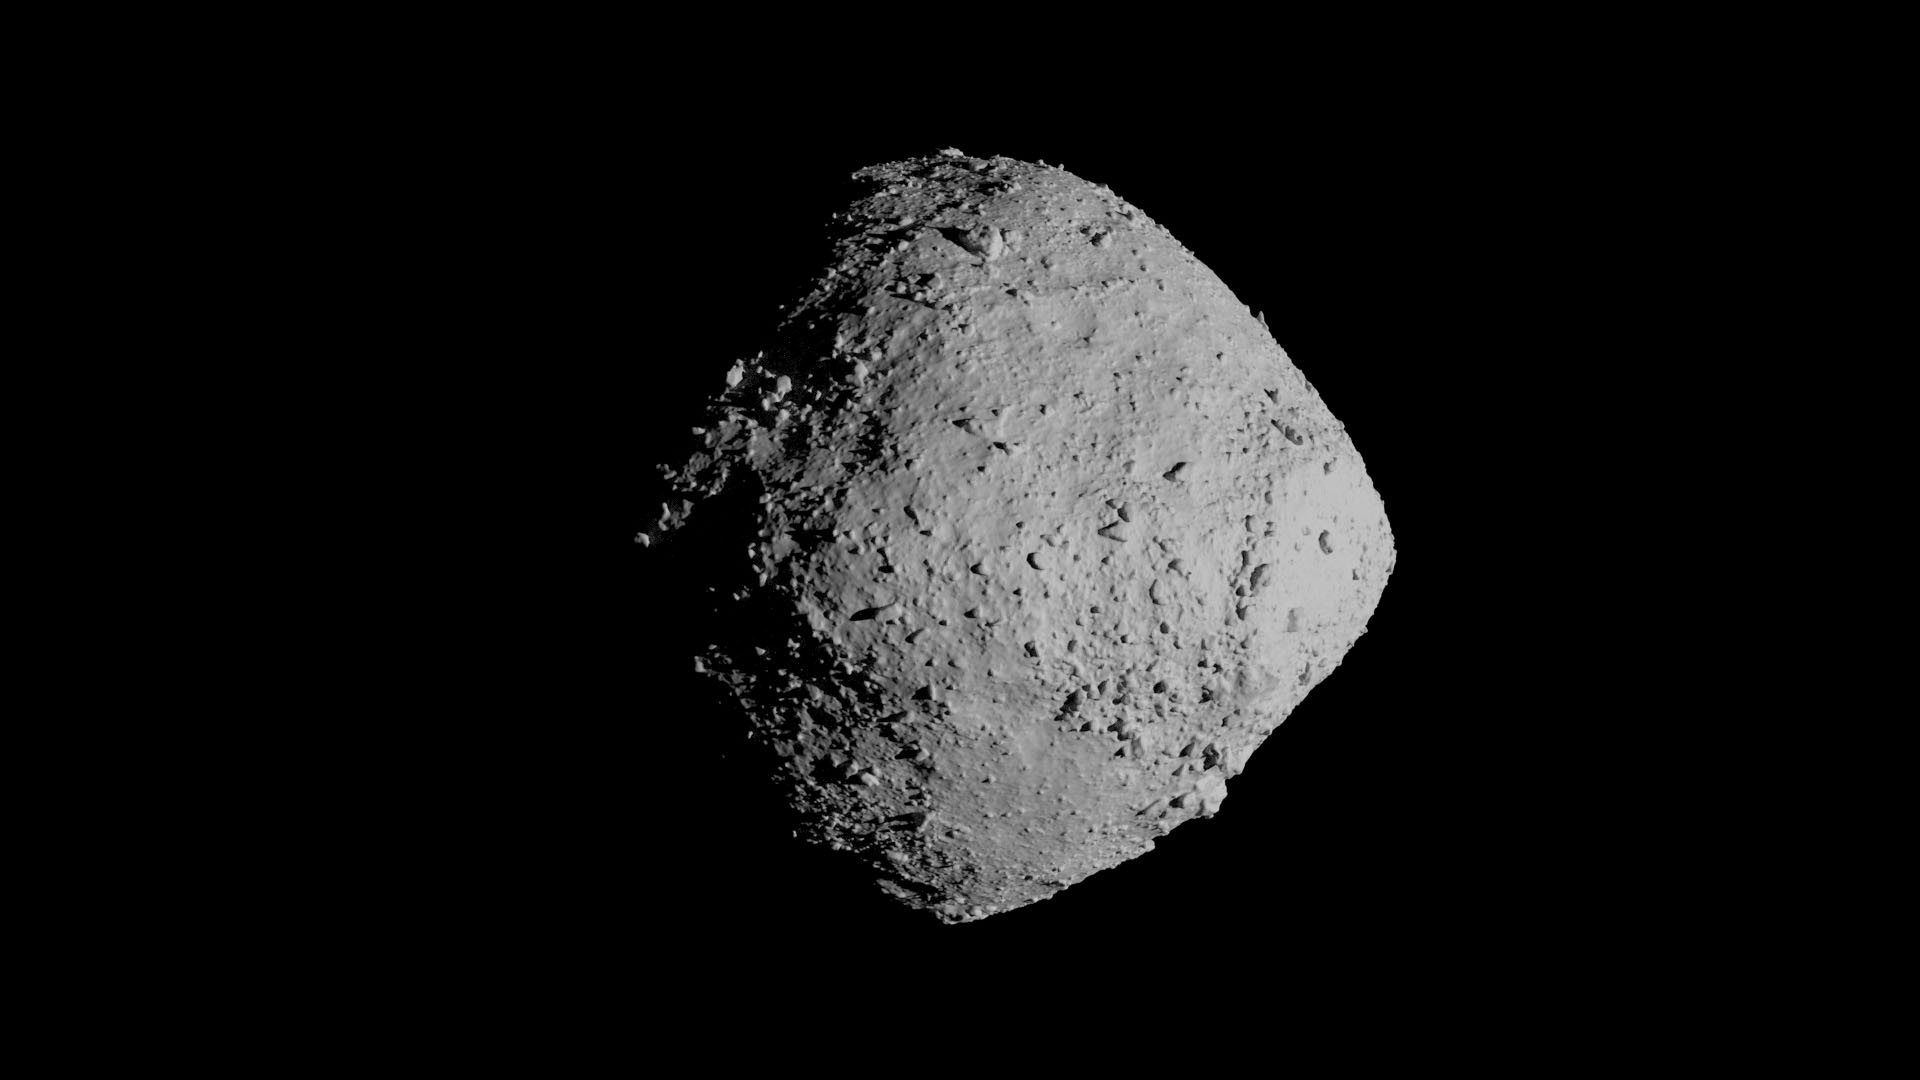
This preview image shows the Bennu global 3D model (OLA v20 PTM) lit from the side.
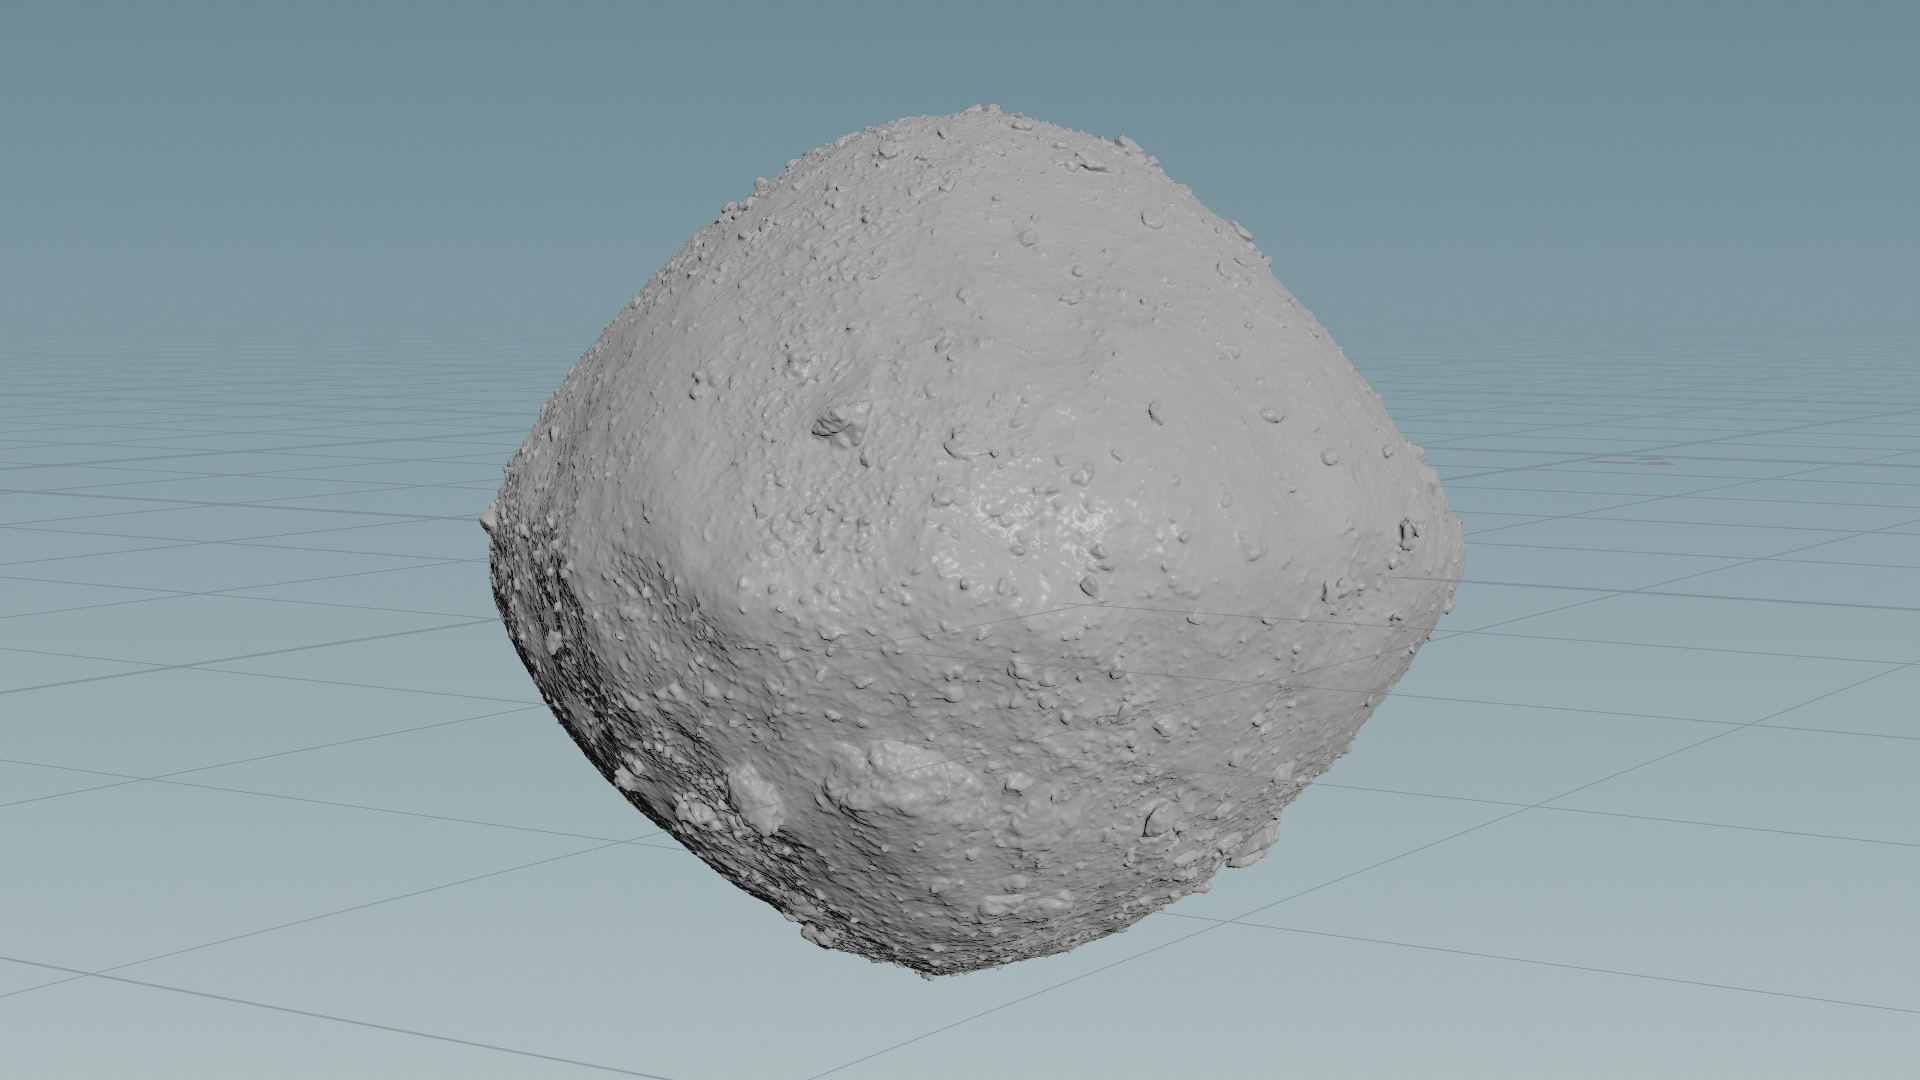
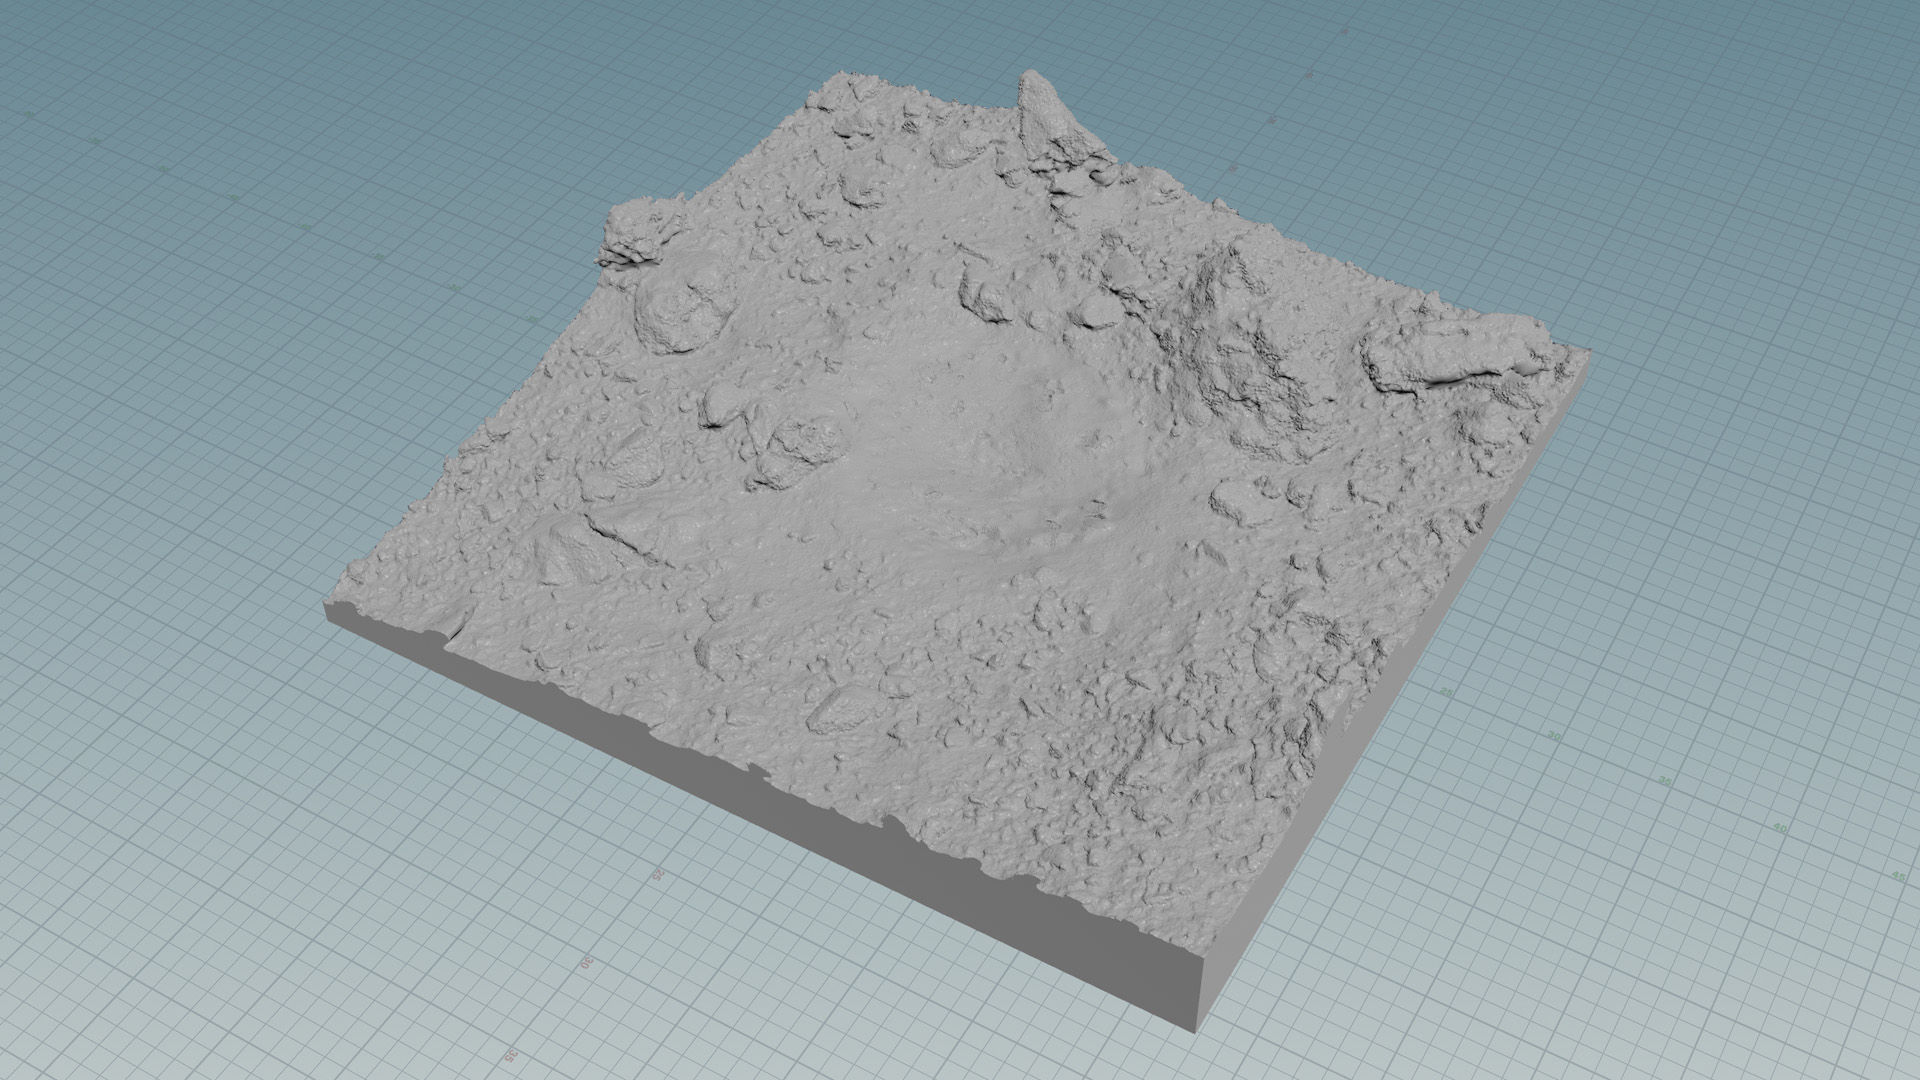
TAG sample site 3D model - 4.3M polygons
This model was used in and described by Daly et al. (2020). This model used a Poisson reconstruction method (Kazhdan et al., 2020), a technique that better captures the undersides and complex geometries of boulders on Bennu.
This model is available in OBJ and glTF (glb) formats. Right click the desired format link below and select “Save Link As…” to download the model.
OBJ (235.9 MB)
GLB (77.3 MB)
This preview image shows the Bennu TAG sample site 3D model lit from the side.
Sample site (before TAG) model prepared for 3D printing.
Right click HERE and select "Save Link As..." to download this model (OBJ 715 MB).
Sample site (after TAG) model prepared for 3D printing.
Right click HERE and select "Save Link As..." to download this model (OBJ 715 MB).
Credits
Please give credit for this item to:
NASA's Scientific Visualization Studio
Data provided by NASA/University of Arizona/CSA/York University/MDA.
-
Visualizer
- Kel Elkins (USRA)
-
Producer
- Dan Gallagher (KBR Wyle Services, LLC)
-
Scientists
- Dathon Golish (The University of Arizona/LPL)
- Dante Lauretta (The University of Arizona)
- Olivier Barnouin (JHUAPL)
- Daniella DellaGiustina (The University of Arizona/LPL)
- Jason Dworkin (NASA/GSFC)
- Bashar Rizk (The University of Arizona)
- Michael Daly (York University)
- Carina Bennett (The University of Arizona)
- Jeff Seabrook (York University)
-
Technical support
- Laurence Schuler (ADNET Systems, Inc.)
- Ian Jones (ADNET Systems, Inc.)
Release date
This page was originally published on Thursday, February 9, 2023.
This page was last updated on Wednesday, May 3, 2023 at 11:43 AM EDT.
Datasets used in this visualization
-
LIDAR [OSIRIS-REx: OLA]
ID: 1055The OSIRIS-REx Laser Altimeter (OLA) is a scanning LIDAR (Light Detection and Ranging). LIDAR is similar to RADAR, but it uses light instead of radio waves to measure distance. OLA emitted laser pulses at the surface of Bennu, which reflected back from the surface and returned a portion of the laser pulse to the LIDAR detector. By carefully measuring the time difference between the outgoing pulse and the incoming pulse, the distance from the spacecraft to the surface of Bennu was computed using the speed of light. This allowed OLA to provide high-resolution topographical information about Bennu during the mission.
See all pages that use this dataset -
Imagery [OSIRIS-REx: OCAMS]
ID: 1063The OSIRIS-REx Camera Suite (OCAMS) consists of three cameras: PolyCam, MapCam, and SamCam. These cameras captured a wealth of imagery during OSIRIS-REx’s time at asteroid Bennu. To help mission planners select a site on Bennu for sample collection, OCAMS provided global image mapping of the asteroid’s surface and more detailed images of potential sample sites. OCAMS also recorded the sampling event during the touch-and-go (TAG) maneuver.
Credit: NASA/University of Arizona/CSA/York University/MDA
See all pages that use this dataset
Note: While we identify the data sets used in these visualizations, we do not store any further details, nor the data sets themselves on our site.