Continental scale carbon stocks of individual trees in African drylands
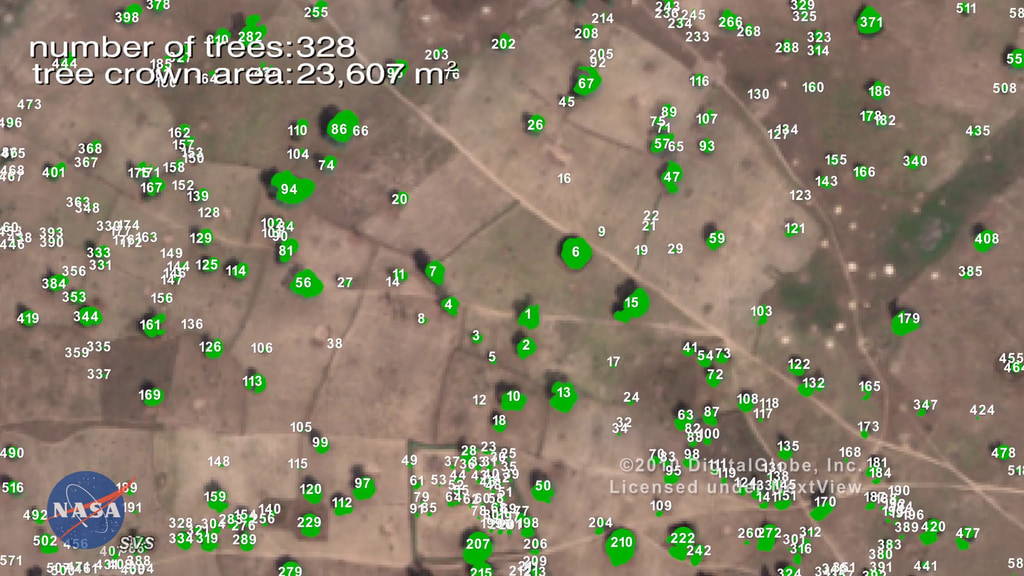
Using commercial, high-resolution satellite images and artificial intelligence, a team of NASA-funded scientists mapped almost 10 billion individual trees in Africa’s drylands in order to assess the amount of carbon stored outside of major forests. The result is the first comprehensive estimate of carbon density in the Saharan, Sahel, and Sudanian zones of Africa.
Complete transcript available.
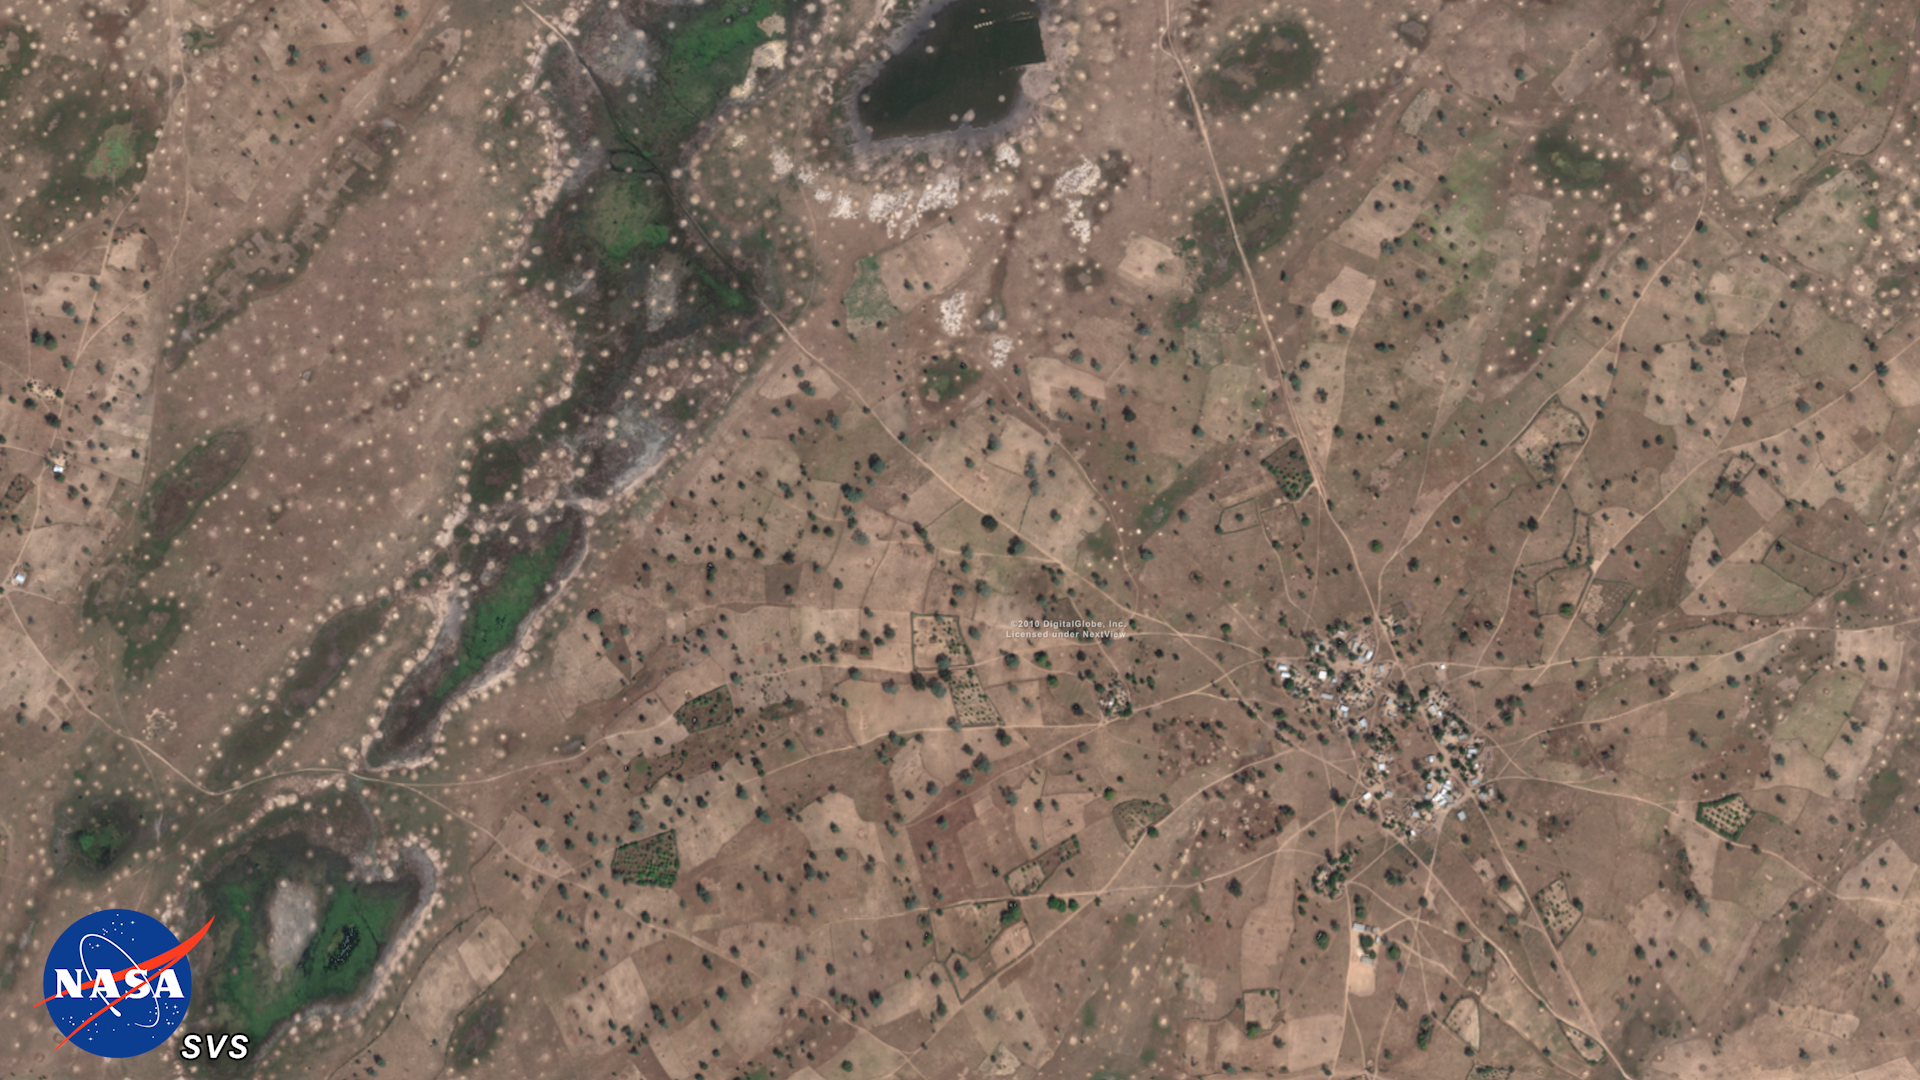
The visualization begins with a view of the study region in northern Africa with climate zones indicated. The camera zooms into a region of satellite imagery and individual trees are identified, along with the amount of carbon stored in each tree. The camera then pulls out to reveal total tree carbon in the study region.

Still image - view of the study region in northern Africa with climate zones indicated.
hyper-arid (0-150 mm/year)
arid (150-300 mm/year)
semi-arid (300-600 mm/year)
sub-humid (600-1000 mm/year)
Still image - Individual trees identified in satellite imagery, color mapped by the amount of carbon they contain
Still image - Total tree carbon in the study region
Color bar legend for carbon per tree, ranging from 10 kg carbon per tree (dark purple) to 1000 kg carbon per tree (bright yellow)
Color bar legend for total carbon, ranging from 0 Mg Carbon per hectare up to 2000 Mg Carbon per hectare
Credits
Please give credit for this item to:
NASA's Scientific Visualization Studio
-
Visualizers
- Kel Elkins (USRA)
- Greg Shirah (NASA/GSFC)
-
Producer
- Kathleen Gaeta (Advocates in Manpower Management, Inc.)
-
Scientists
- Compton Tucker (NASA/GSFC)
- Jesse R. Meyer (SSAI)
- Martin Brandt (University of Copenhagen)
-
Technical support
- Laurence Schuler (ADNET Systems, Inc.)
- Ian Jones (ADNET Systems, Inc.)
Release date
This page was originally published on Wednesday, March 1, 2023.
This page was last updated on Sunday, April 21, 2024 at 11:16 PM EDT.
Series
This visualization can be found in the following series:Datasets used in this visualization
-
BMNG (Blue Marble: Next Generation) [Terra and Aqua: MODIS]
ID: 508Credit: The Blue Marble data is courtesy of Reto Stockli (NASA/GSFC).
This dataset can be found at: http://earthobservatory.nasa.gov/Newsroom/BlueMarble/
See all pages that use this dataset -
WorldView-2 © 2010 DigitalGlobe
ID: 996 -
Band Combination 4-3-2 [Landsat-8: OLI/TIRS]
ID: 1086 -
Rasterized Tree Crowns (generated via ML from DigitalGlobe mosaics)
ID: 1095
Note: While we identify the data sets used in these visualizations, we do not store any further details, nor the data sets themselves on our site.
Related
- ID: 13736
- ID: 4865