A newer version of this visualization is available.
Landsat Next Planned Orbits and Swath Coverage
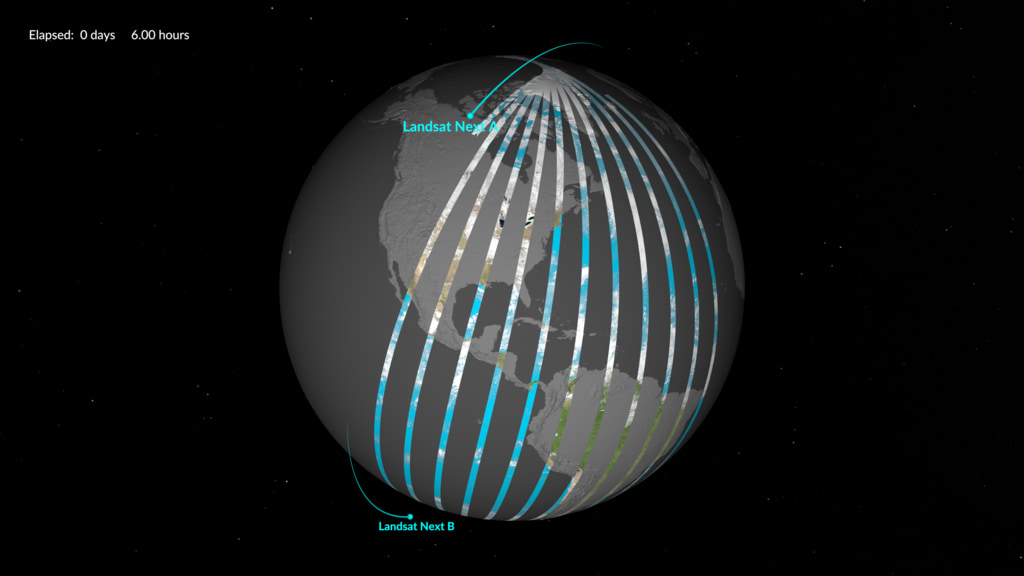
Landsat Next observatories viewed from near the equator
Landsat Next is the follow on mission to Landsat-9. Landsat Next which will provide data continuity to the decades long data record of the Earth’s land from space. It is still in the planning stages and is targeted for launch around 2030. Landsat Next is planned to have more than twice the number of bands as Landsat 8 and 9 and will consist of 3 separate spacecraft. This reduces amount of time needed for full Earth coverage to around 6 days.
These visualizations show example orbits and swaths of Landsat Next. The orbit swath widths shown are 164km wide. There are 2 versions: one is more equatorial, the other is more polar.
The equatorial view shows the spacecraft orbits and swaths slowly appearing, revealing the colored Earth tiles. The orbits speed up showing the distances between orbits. The speed increases showing several days quickly. Finally, the orbits slow down as the last few orbits complete the full coverage of the Earth about 6 days from when it started.
The polar view shows the same thing from a different camera view. The polar view highlights the approximate 10:10am crossing time of the daytime (descending) orbits. It also shows how the swaths have more overlap near the poles than near the equator. The yellow arrow is the where the sun shines directly down onto the Earth.
Landsat Next observatories viewed from above the North Pole
For More Information
Credits
Please give credit for this item to:
NASA's Scientific Visualization Studio
-
Visualizer
- Greg Shirah (NASA/GSFC)
-
Producer
- Matthew Radcliff (KBR Wyle Services, LLC)
-
Flight dynamics navigation engineer
- Donald Dichmann (NASA)
-
Technical support
- Laurence Schuler (ADNET Systems, Inc.)
- Ian Jones (ADNET Systems, Inc.)
Release date
This page was originally published on Wednesday, December 21, 2022.
This page was last updated on Thursday, July 27, 2023 at 10:39 PM EDT.
Missions
This visualization is related to the following missions:Datasets used in this visualization
-
GTOPO30 Topography and Bathymetry
ID: 274 -
BMNG (Blue Marble: Next Generation) [Terra and Aqua: MODIS]
ID: 508Credit: The Blue Marble data is courtesy of Reto Stockli (NASA/GSFC).
This dataset can be found at: http://earthobservatory.nasa.gov/Newsroom/BlueMarble/
See all pages that use this dataset -
Planning TLEs
ID: 1144 -
SVS Deep Star Maps 2020
ID: 1145Ernie Wright's star maps
Credit: Ernie Wright
This dataset can be found at: https://svs.gsfc.nasa.gov/4851
See all pages that use this dataset
Note: While we identify the data sets used in these visualizations, we do not store any further details, nor the data sets themselves on our site.
Newer Versions
- ID: 5112