Temperature Measurement Stations
Weather stations currently used in the GISS Surface Temperature Analysis (v4). The size of the station markers is varied to reduce overplotting and is not indicative of any properties of that station.
The weather stations used in the GISS Surface Temperature Analysis (v4). In this analysis only stations with reasonably long, consistently measured time records are used. 20,924 stations are shown in this visualization. For more information on the station data, please visit https://data.giss.nasa.gov/gistemp/station_data_v4_globe/.

A map of the weather stations currently used in the GISS Surface Temperature Analysis (v4) in Robinson projection.
Credits
Please give credit for this item to:
NASA's Scientific Visualization Studio
-
Visualizers
- Mark SubbaRao (NASA/GSFC)
- Andrew J Christensen (SSAI)
-
Producer
- Kathryn Mersmann (KBR Wyle Services, LLC)
-
Technical support
- Laurence Schuler (ADNET Systems, Inc.)
- Ian Jones (ADNET Systems, Inc.)
Release date
This page was originally published on Saturday, December 25, 2021.
This page was last updated on Tuesday, November 21, 2023 at 12:48 PM EST.
Datasets used in this visualization
-
GISTEMP [GISS Surface Temperature Analysis (GISTEMP)]
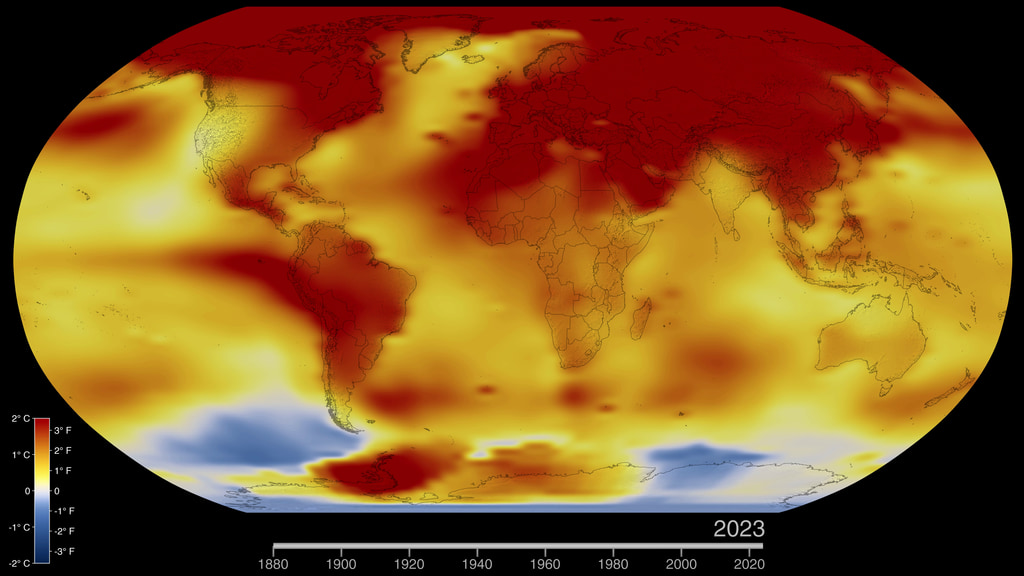
ID: 585The GISS Surface Temperature Analysis version 4 (GISTEMP v4) is an estimate of global surface temperature change. Graphs and tables are updated around the middle of every month using current data files from NOAA GHCN v4 (meteorological stations) and ERSST v5 (ocean areas), combined as described in our publications Hansen et al. (2010) and Lenssen et al. (2019).
Credit: Lenssen, N., G. Schmidt, J. Hansen, M. Menne, A. Persin, R. Ruedy, and D. Zyss, 2019: Improvements in the GISTEMP uncertainty model. J. Geophys. Res. Atmos., 124, no. 12, 6307-6326, doi:10.1029/2018JD029522.
This dataset can be found at: https://data.giss.nasa.gov/gistemp/
See all pages that use this dataset
Note: While we identify the data sets used in these visualizations, we do not store any further details, nor the data sets themselves on our site.
Related
- ID: 5207
 Visualization
 - ID: 4964
 Visualization
Used as a Source In
- ID: 14066
![Universal Production Music: Knock and Wait (Instrumental) by Brice Davoli [SACEM], Well That’s Difference (Instrumental) by Jeff Cardoni [ASCAP], Wanna Be Hipster (Instrumental) by Jeff Cardoni [ASCAP], Curiosity Killed Kitty (Instrumental) by Robert Leslie Bennett [ASCAP], Eco Issues (Instrumental) by Max van Thun [GEMA] Additional Footage: Pond5.com, CSPANComplete transcript available.](/vis/a010000/a014000/a014066/Title.jpg) Produced Video
Produced Video