Terra Orbit Drift
This visualization illustrates the milestones of Terra’s drift in orbit and showcases its impacts to shadow length and swath width from the change in crossing time.
Terra has consistently orbited Earth from pole to pole for over twenty years, collecting important data about Earth’s systems. Crossing the equator at 10:30 am mean local time allowed Terra’s five instruments to collect consistent, simultaneous data, important to Earth’s systems research and applications. In 2020, Terra completed its final inclination maneuver, using some of its limited fuel supply, to maintain that crossing time.
Since that final inclination maneuver, Terra has continuously drifted to an earlier equatorial crossing time. By the Fall of 2022, Terra’s crossing time will be earlier than 10:15 am. To ensure Terra, with limited fuel supplies, is a safe distance from other missions in the Earth Observing Satellite constellation orbit, Terra will be lowered to a new orbit, where it will be able to collect valuable data at an even earlier crossing time.
As Terra’s crossing time creeps earlier, small changes will be noticeable in the data and imagery collected by the instruments aboard Terra. Evidence in imagery of the earlier crossing time will be visible as longer shadows, especially in mountain landscapes. Meanwhile as Terra moves closer to Earth, the sensors’ views will become narrower leading to slightly smaller swath widths (less than 1% smaller). The effect will be most noticeable in ASTER imagery, but each of Terra’s sensors will be affected. However, the impact on science is expected to be minimal. In fact, some impacts could prove beneficial to some areas of research, like land morphology, surface temperature, and climate research.
Terra’s lengthy legacy of more than two decades of data will continue to contribute to meaningful research of Earth’s Systems science for years to come.
A view of Terra’s orbit in December 2020. An orange sphere marks the location where the orbit passes over the equator (descending node). The visualization starts with a view orthogonal to the orbit plane.
A view of Terra’s orbit in December 2021. An orange sphere marks the location where the orbit passes over the equator (descending node). A white sphere marks the location where the orbit previously passed over the equator in December 2020.
A view of Terra’s orbit in December 2022. An orange sphere marks the location where the orbit passes over the equator (descending node). White spheres mark the locations where the orbit passed over the equator in previous years.
A view of Terra’s orbit in December 2023. An orange sphere marks the location where the orbit passes over the equator (descending node). White spheres mark the locations where the orbit passed over the equator in previous years.
A view of Terra’s orbit in December 2024. An orange sphere marks the location where the orbit passes over the equator (descending node). White spheres mark the locations where the orbit passed over the equator in previous years.
A view of Terra’s orbit in December 2025. An orange sphere marks the location where the orbit passes over the equator (descending node). White spheres mark the locations where the orbit passed over the equator in previous years.

Graph depicting the change in mean local time of the descending node between December 2020 and December 2026. The current time marked on the graph is December 2020. Sphere markers on the graph mimic the location markers used in the orbit visualizations above.
Graph depicting the change in mean local time of the descending node between December 2020 and December 2026. The current time marked on the graph is December 2021. Sphere markers on the graph mimic the location markers used in the orbit visualizations above.
Graph depicting the change in mean local time of the descending node between December 2020 and December 2026. The current time marked on the graph is December 2022. Sphere markers on the graph mimic the location markers used in the orbit visualizations above.
Graph depicting the change in mean local time of the descending node between December 2020 and December 2026. The current time marked on the graph is December 2023. Sphere markers on the graph mimic the location markers used in the orbit visualizations above.
Graph depicting the change in mean local time of the descending node between December 2020 and December 2026. The current time marked on the graph is December 2024. Sphere markers on the graph mimic the location markers used in the orbit visualizations above.
Graph depicting the change in mean local time of the descending node between December 2020 and December 2026. The current time marked on the graph is December 2025. Sphere markers on the graph mimic the location markers used in the orbit visualizations above.
Diagram depicting how a change in orbit altitude impacts data swath width. This diagram is not to scale.
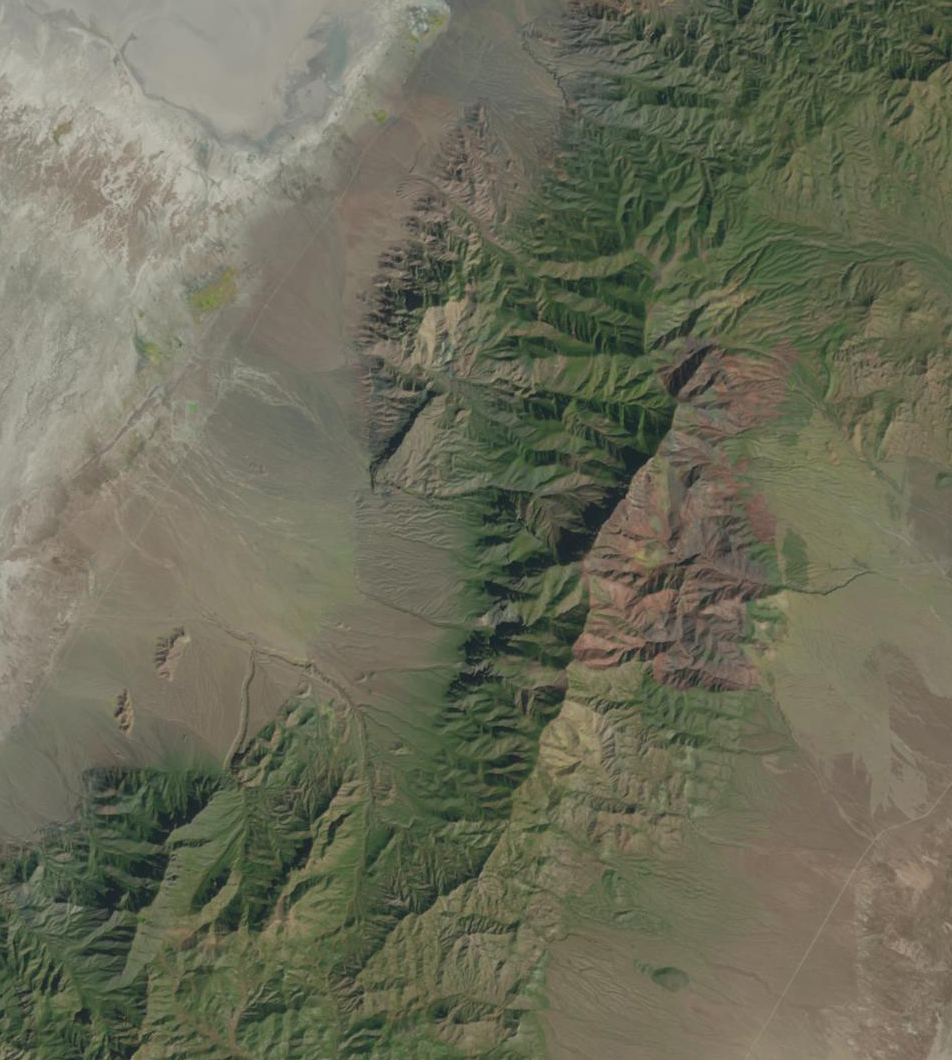
Representative satellite imagery showing typical lighting conditions at 10:30am. This image was taken by the the Earth Observing-1 satellite.
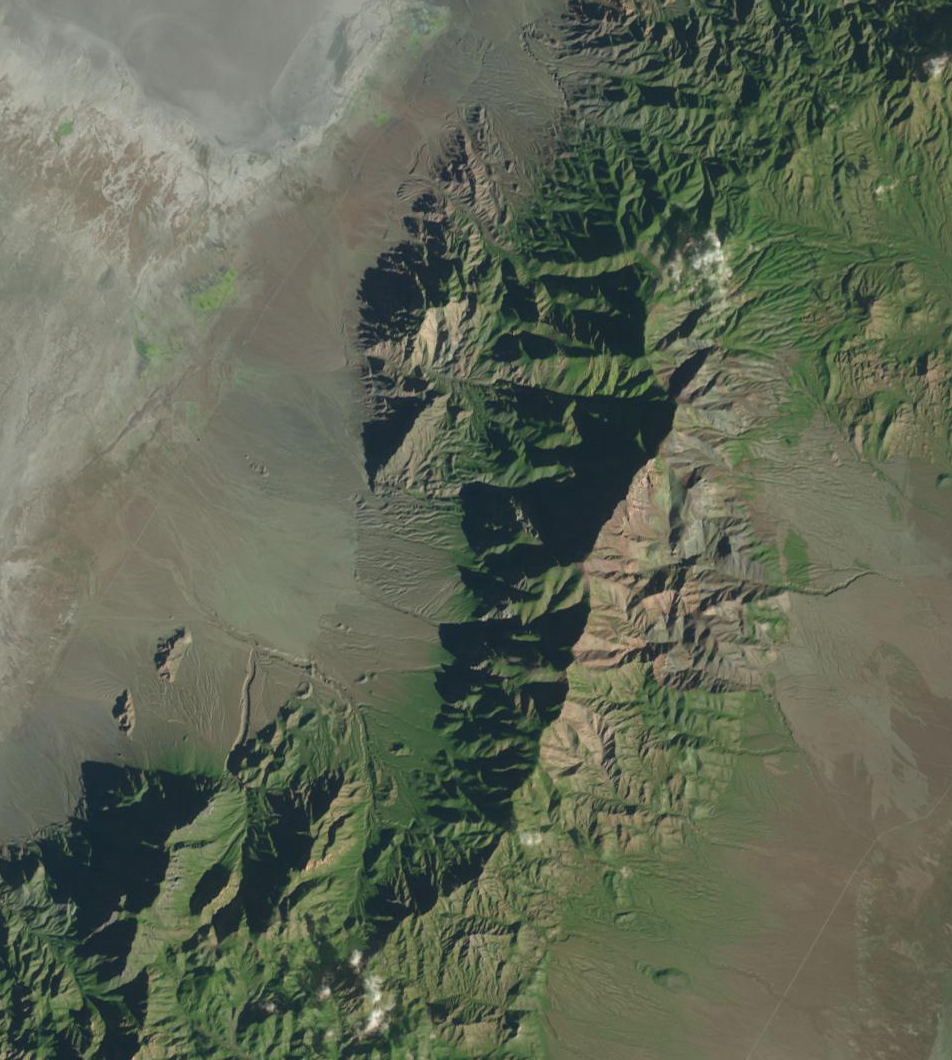
Representative satellite imagery showing typical lighting conditions at 9:00am. This image was taken by the the Earth Observing-1 satellite.
Credits
Please give credit for this item to:
NASA's Scientific Visualization Studio
-
Visualizer
- Kel Elkins (USRA)
-
Producers
- Tassia Owen (Global Science and Technology, Inc.)
- Elizabeth C. Wilk (KBR Wyle Services, LLC)
-
Scientists
- Lahouari Bounoua (NASA/GSFC)
- Robert E Wolfe (NASA)
- Kurtis Thome (NASA)
-
Engineers
- Dimitrios Mantziaras (NASA)
- Jason Hendrickson (KBR Wyle Services, LLC)
Release date
This page was originally published on Friday, September 24, 2021.
This page was last updated on Wednesday, May 3, 2023 at 1:43 PM EDT.
Datasets used in this visualization
-
True Color [EO-1: ALI]
ID: 306 -
GSFC Flight Dynamics Facility Ephemeris
ID: 812
Note: While we identify the data sets used in these visualizations, we do not store any further details, nor the data sets themselves on our site.
Used as a Source In
- ID: 14015
!["From Small Beginnings," by Jay Price [PRS]; Universal Production Music](/vis/a010000/a014000/a014015/14015_4938_TerraDrift_FINAL.02577_print.jpg) Produced Video
Produced Video