ICON Snaps a Peek at the Ionospheric Dynamo
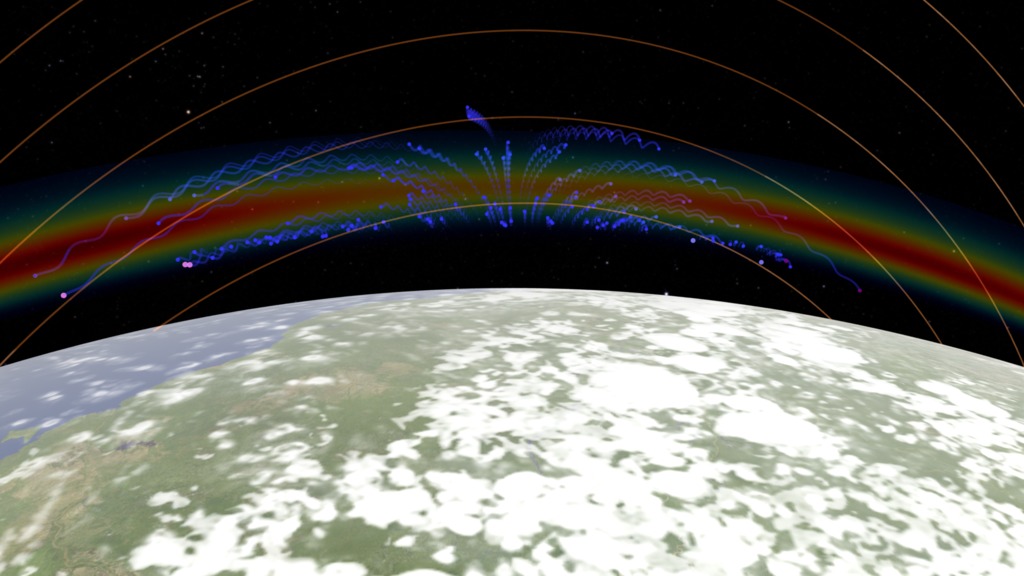
Visualization of ICON in Earth orbit, camera ahead of the spacecraft looking back on spacecraft and limb of Earth. Magenta curves are lines of Earth's geomagnetic field. Field-of-view (FOV) of MIGHTI imagers (green frustums) and the longitudinal wind vectors (green arrows) it measures are shown. MIGHTI imagers FOV eventually fades out. Vertical plasma speed (red arrows) is measured at the spacecraft. Magnetic field lines turn yellow as measurements of winds by MIGHT provide a connection to influence the plasma velocity measured at the spacecraft, redirecting the plasma flow from upward to downward.
As one rises through the turbulent atmosphere of Earth, the density of the air decreases and winds become faster. From above, solar radiation as visible and ultraviolet light, along with energetic particles, rain down on the atmospheric gases splitting electrically neutral atoms and molecules into ions and free electrons. This process forms the high-altitude atmospheric region we call the ionosphere. The charged particles formed here interact with Earth's magnetic field to form more complex structures, such as equatorial ionization anomaly (EIA) also known as the Appleton anomaly formed by a process called the equatorial fountain. These interactions drive a process called the ionospheric dynamo.
But these high-altitude winds are not uniform. They are often altered by weather changes in the lower-altitude atmosphere, and this can drive changes in the particle motion high in the ionosphere.
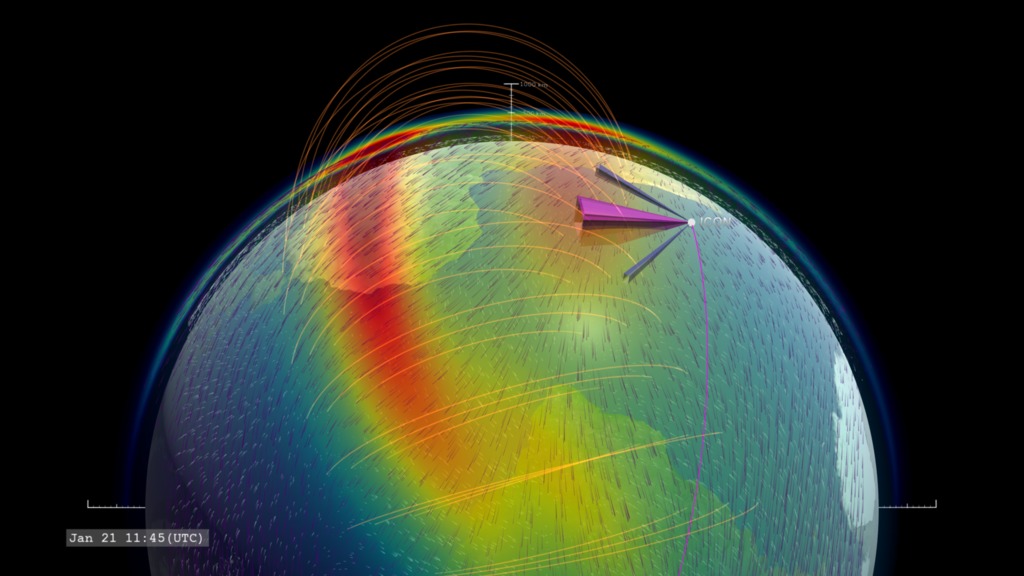
The ICON satellite has instruments that measure charged particle motion though the region it travels (Ion Velocity Meter or IVM), and also winds on the limb of Earth (measured by MIGHTI). Sometimes these two regions are connected by a magnetic field line and we can actually 'see' how a change in lower altitude winds can drive a change in the high altitude charged particle motions. In the visualizations above, this process takes place between the 01:52 and 01:56 timestamp, highlighted with yellow magnetic field lines. We see the wind speed (green arrows on the left) change direction and switch the charged particle flow measured at the spacecraft (red arrows) from upward to downward.
Visualization of ICON in Earth orbit, camera is above the spacecraft looking down on spacecraft and limb of Earth as seen by MIGHTI. Magenta curves are lines of Earth's geomagnetic field. Field-of-view (FOV) of MIGHTI imagers (green frustums) and the longitudinal wind vectors (green arrows) it measures are shown. MIGHTI imagers FOV eventually fades out. Vertical plasma speed (red arrows) is measured at the spacecraft. Magnetic field lines turn yellow as measurements of winds by MIGHT provide a connection to influence the plasma velocity measured at the spacecraft, redirecting the plasma flow from upward to downward.
Visualization of ICON in Earth orbit, camera traveling alongside the spacecraft. Magenta curves are lines of Earth's geomagnetic field. Field-of-view (FOV) of MIGHTI imagers (green frustums) and the longitudinal wind vectors (green arrows) it measures are shown. MIGHTI imagers FOV eventually fades out. Vertical plasma speed (red arrows) is measured at the spacecraft. Magnetic field lines turn yellow as measurements of winds by MIGHT provide a connection to influence the plasma velocity measured at the spacecraft, redirecting the plasma flow from upward to downward.
Visualization of ICON in Earth orbit, camera aside and above of the spacecraft looking back on spacecraft and limb of Earth. Magenta curves are lines of Earth's geomagnetic field. Field-of-view (FOV) of MIGHTI imagers (green frustums) and the longitudinal wind vectors (green arrows) it measures are shown. MIGHTI imagers FOV eventually fades out. Vertical plasma speed (red arrows) is measured at the spacecraft. Magnetic field lines turn yellow as measurements of winds by MIGHT provide a connection to influence the plasma velocity measured at the spacecraft, redirecting the plasma flow from upward to downward.
Visualization opens with a wide view of ICON in Earth orbit. Magenta curves are lines of Earth's geomagnetic field. Camera does a slow push-in to closer to ICON showing field-of-view of MIGHTI imagers (green frustums) and the longitudinal wind vectors (green arrows) it measures. Vertical plasma speed (red arrows) are measured at the spacecraft.
Visualization opens with a wide view of ICON in Earth orbit. Magenta curves are lines of Earth's geomagnetic field. Camera does a slow push-in to closer to ICON showing field-of-view of MIGHTI imagers (green frustums) and the longitudinal wind vectors (green arrows) it measures. Vertical plasma speed (red arrows) are measured at the spacecraft. Camera does a slow orbit around the spacecraft.
Credits
Please give credit for this item to:
NASA's Scientific Visualization Studio
-
Visualizer
- Tom Bridgman (Global Science and Technology, Inc.)
-
Scientists
- Brian Harding (SSL Berkeley)
- Tom Immel (SSL Berkeley)
-
Technical support
- Laurence Schuler (ADNET Systems, Inc.)
- Ian Jones (ADNET Systems, Inc.)
-
Producer
- Joy Ng (KBR Wyle Services, LLC)
-
Writer
- Kathalina Tran (SGT)
Release date
This page was originally published on Monday, November 29, 2021.
This page was last updated on Wednesday, November 15, 2023 at 12:17 AM EST.
Missions
This visualization is related to the following missions:Series
This visualization can be found in the following series:Datasets used in this visualization
-
IVM (IVM) [ICON: Ion Velocity Meter]
ID: 1120This dataset can be found at: https://icon.ssl.berkeley.edu/Observatory/Instruments/IVM
See all pages that use this dataset -
MIGHTI (MIGHTI) [ICON: Michelson Interferometer for Global High-resolution Thermospheric Imaging]
ID: 1121This dataset can be found at: https://icon.ssl.berkeley.edu/Instruments/MIGHTI
See all pages that use this dataset
Note: While we identify the data sets used in these visualizations, we do not store any further details, nor the data sets themselves on our site.
Related
- ID: 14025
 Produced Video
 - ID: 4617
 Visualization
 - ID: 4594
 Visualization