Variability of Water Storage in Global Hydrological Basins
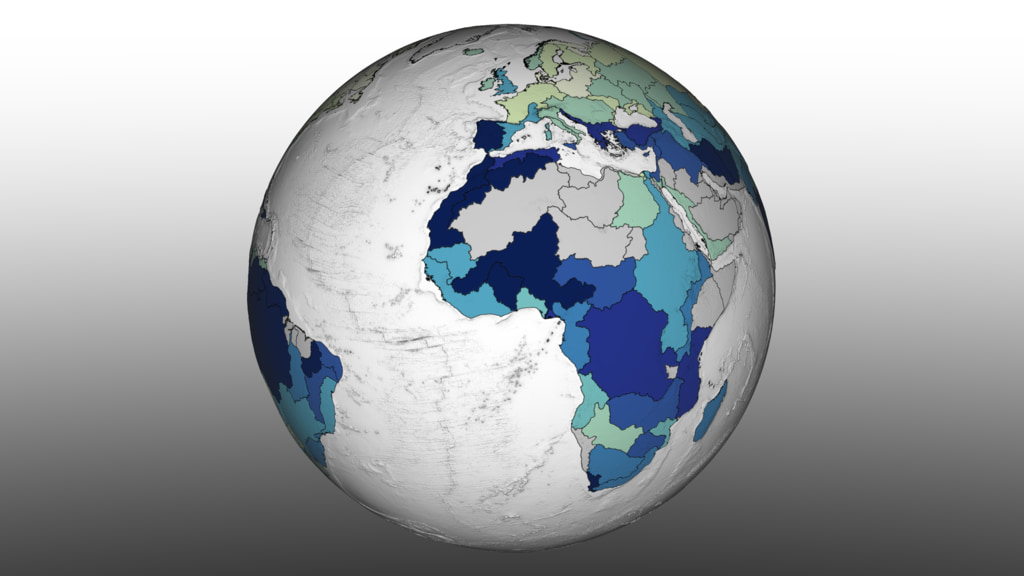
Variability of Water Level
Knowing the extent of human influence on the global hydrological cycle is essential for the sustainability of freshwater resources on Earth. However, a lack of water level observations for the world’s ponds, lakes, and reservoirs has limited quantification of reservoir (human-managed) versus natural changes to surface water storage. In this study, scientists used data from NASA's ICESat-2 satellite laser altimeter to quantify global variability in water level over 227,386 water bodies from October 2018 to July 2020.
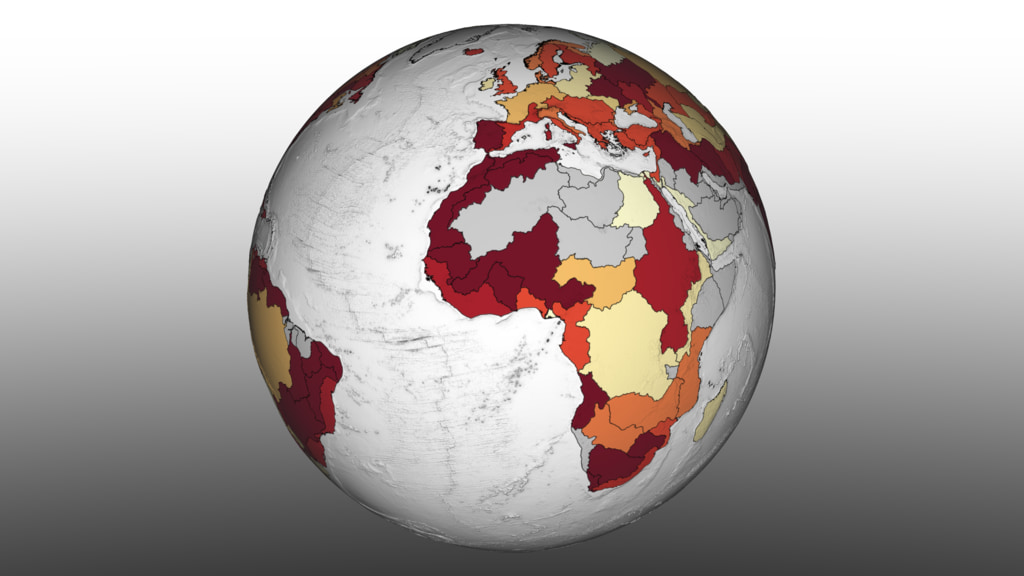
By combining this dataset with a global database of human-managed reservoirs, the study found that 57% of seasonal water storage variability occurs in human-managed reservoirs. Global maps of the results organized by hydrologic basin reveal that natural variability in surface water level is greatest in tropical basins like the Amazon and the Congo and lowest in northern and Arctic areas such as Northern Canada and Alaska. In contrast, human-management of surface water storage in arid and semi-arid regions like the Western US, Middle East, Southern Africa and Australia, where human influence drives nearly 100% of seasonal storage variability. Overall, the finding that humans are responsible for the majority of seasonal surface water storage variability shows that we are now a key regulator of the water cycle.
As economic development, population growth, and climate change continue to pressure global water resources in the future, measurements from satellites like ICESat-2 will continue to provide vital information about how humans are managing freshwater resources worldwide.
This animation uses data from the study to visualize two quantities: the variability of water level, and the variability of the percent of water storage from man-made reservoirs.
Storage Variability Attributed to Reservoirs
Variability of Water Level, No Colorbar
Storage Variability Attributed to Reservoirs, No Colorbar

Colorbar, Variability of Water Level
Colorbar, Storage Variability Attributed to Reservoirs
Credits
Please give credit for this item to:
NASA's Scientific Visualization Studio
-
Visualizer
- Trent L. Schindler (USRA)
-
Scientist
- Sarah Cooley (Stanford University)
-
Producer
- Ryan Fitzgibbons (USRA)
Release date
This page was originally published on Wednesday, March 3, 2021.
This page was last updated on Wednesday, November 15, 2023 at 12:17 AM EST.
Datasets used in this visualization
-
[ICESat-2: Advanced Topographic Laser Altimeter System (ATLAS)]
ID: 1112
Note: While we identify the data sets used in these visualizations, we do not store any further details, nor the data sets themselves on our site.
Used as a Source In
- ID: 13824
 Produced Video