Ecological insights from three decades of animal movement tracking across a changing Arctic
Animal movement tracking across the arctic on top of seasonal natural phenomena like changing vegetation, snow (white), and sea ice (light purple).
This video is also available on our YouTube channel.
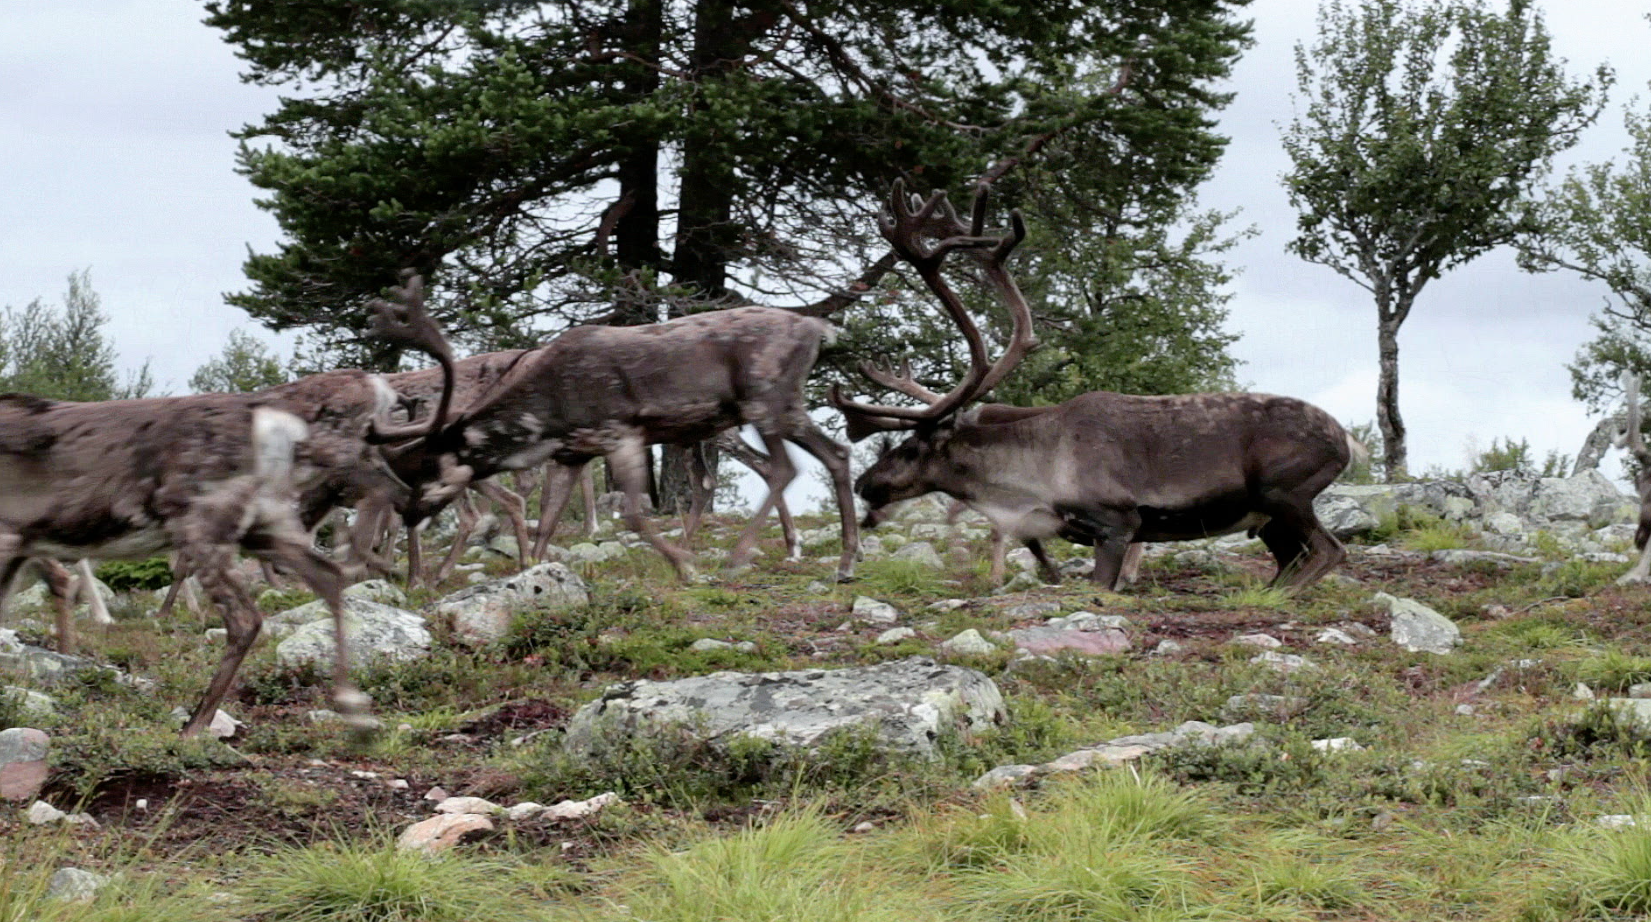
The Arctic Animal Movement Archive (AAMA) is a new and growing collection of studies describing movements of animals in and near the Arctic. The AAMA includes millions of locations of thousands of animals over more than three decades, recorded by hundreds of scientists and institutions. By compiling these data, the AAMA supports public data discovery, preserves fundamental baseline data for the future, and facilitates efficient, collaborative data analysis. We have used the AAMA to document climatic influences on the migration phenology of golden eagles, geographic differences in the adaptive response of caribou reproductive phenology to climate change, species-specific changes in terrestrial mammal movement rates in response to increasing temperature, and the utility of animal-borne sensors as proxies for ambient air temperature. The AAMA is a living archive that can be used to uncover other such changes, investigate their causes and consequences, and recognize larger ecosystem changes taking place in the Arctic.
These visualizations show AAMA animal location data. Some of the visualizations collpase the years down as if all of the data were from the same year; others show the data with the years passing. Several different groupings of animals are shown: marine mammals, raptors, seabirds, shorebirds, terrestrial mammals, and waterbirds. Snow and sea ice are also shown for context as they correlate to animal movements.
Citation: Ecological insights from three decades of animal movement tracking across a changing Arctic. S.C. Davidson, et al. Science 06 Nov 2020: Vol. 370, Issue 6517, pp. 712-715 DOI: 10.1126/science.abb7080
Data citation: The Arctic Animal Movement Archive (AAMA) is a collection of studies that contain animal movement and other animal-borne sensor data from the Arctic and Subarctic, owned by hundreds of participating experts and organizations. As of November 2020, this collection includes 214 studies that contain over 43 million locations of over 12,000 animals recorded from 1988 to the present. Initial development of the AAMA was funded by NASA's Arctic-Boreal Vulnerability Experiment. The AAMA is hosted on Movebank, a free, global research platform for animal movement and animal-borne sensor data. Long-term support for the storage and curation of the AAMA in Movebank comes from the Max Planck Institute of Animal Behavior. Visit the archive to learn more and find out how to participate.
NASA Media: https://www.nasa.gov/feature/goddard/2020/arctic-animals-movement-patterns-are-shifting-in-different-ways-as-the-climate-changes
AGU iPoster: https://agu2020fallmeeting-agu.ipostersessions.com/Default.aspx?s=1C-9F-40-11-B3-77-C2-50-6F-F3-B1-3B-60-B4-93-5E#
AGU Hyperwall Talk: [placeholder]
All animal locations for all years shown together on a spinning globe
Animal locations shown with all years at once (i.e., the year is ignored; only the month and day are used to determine which points are shown). 30 days of data are shown every frame
Locations of raptors migrating from Canada and Alaska in 1999. In this visualization, about 84% are Golden Eagles (Aquila chrysaetos), 14% are Bald eagles (Haliaeetus leucocephalus) and 2% are Osprey (Pandion haliaetus).
Animal locations from a single grey wolf from 10 Jan 2014 to 17 Feb 2014 with a Landsat-8 data tile used for the high resolution closeup
Animal locations through the years showing North and South America. 60 days worth of data are shown every frame

Colors for each animal grouping: red=marine mammals, green=raptors, purple=seabirds, orange=shorebirds, yellow=terrestrial mammals, brown=waterbirds
Global temperature anomaly average from 2015-2019 based on GISS Surface Temperature Analysis ± 2 degrees celcius (blues are lower than normal, reds are higher than normal). The color bar is the same one that was used here.
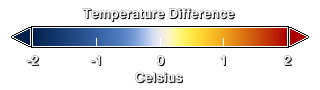
Colorbar for the global temperature anomaly. Blue is colder than the average temperature for that area, and red is warmer than the average temperature.
Credits
Please give credit for this item to:
NASA's Scientific Visualization Studio
-
Visualizers
- Greg Shirah (NASA/GSFC)
- Lori Perkins (NASA/GSFC)
- Helen-Nicole Kostis (USRA)
-
Scientists
- Peter Griffith (SSAI)
- Roland Kays (North Carolina State University)
- Gil Bohrer (Ohio State University)
- Candace Vinciguerra (North Carolina State University)
-
Data curator
- Sarah Davidson (Max Planck Institute of Animal Behavior)
-
Technical support
- Laurence Schuler (ADNET Systems, Inc.)
- Ian Jones (ADNET Systems, Inc.)
Release date
This page was originally published on Monday, April 5, 2021.
This page was last updated on Thursday, June 22, 2023 at 9:49 AM EDT.
Datasets used in this visualization
-
BMNG (Blue Marble: Next Generation) [Terra and Aqua: MODIS]
ID: 508Credit: The Blue Marble data is courtesy of Reto Stockli (NASA/GSFC).
This dataset can be found at: http://earthobservatory.nasa.gov/Newsroom/BlueMarble/
See all pages that use this dataset -
10 km Daily Sea Ice Concentration [SHIZUKU (GCOM-W1): AMSR2]
ID: 795Credit: AMSR2 data courtesy of the Japan Aerospace Exploration Agency (JAXA).
See all pages that use this dataset -
Band Combination 5, 4, 3 [Landsat-8: OLI]
ID: 862 -
Arctic Animal Movement Archive (AAMA)
ID: 1102A collection of studies that contain animal movement and other animal-borne sensor data from the Arctic and Subarctic, owned by hundreds of participating experts and organizations.
Credit: Authors of the animal movement data shown here include Tomas Aarvak, Jason Akearok, Christine Anderson, Rebecca Bentzen, Andrew Berdahl, Dominique Berteaux, Joël Bêty, Natalie Boelman, Dmitrijs Boiko, Stan Boutin, Sean Boyd, Kurt K. Burnham, David Cabot, Magda Chudzinska, Shanti Davis, Chris DeSorbo, David Douglas, Amanda Droghini, Goetz Eichhorn, Kyle Elliott, Craig Ely, Michael Exo, Steve Ferguson, Wolfgang Fiedler, Paul Flint, Steve Furguson, Stefan Garthe, Anthony Gaston, Grant Gilchrist, Petr Glazov, Larry Griffin, Autumn-Lynn Harrison, Scott Hatch, Mark Hebblewhite, Holly Hennin, Mark Hipfner, Jerry Hupp, Michael Janssen, Jim A. Johnson, Kyle Joly, Andrea Kölzsch, Thiemo Karwinkel, Roland Kays, Helmut Kruckenberg, Benjamin J. Lagassé, JF Lamarre, Richard Lanctot, Dave Latham, Christopher Latty, Jim Lawler, Don-Jean Léandri-Breton, Oliver Love, Christie Macdonald, Jesper Madsen, Mark Maftei, Mark Mallory, Pete Marra, Laura McFarlane Tranquilla, Carol McIntyre, Emily McKinnon, WA Montevecchi, Tong Mu, Eric Neilson, Pete Nye, Ruth Oliver, Allison Patterson, Wibke Peters, Aevar Petersen, Margaret Petersen, Ivan Pokrovsky, Rui Prieto, Petra Quillfeldt, Jennie Rausch, Audrey Robillard, Mike Russell, Dan Ruthrauff, Daniel Ruthrauff, Sarah Saalfeld, Joel Schmutz, Dale Seip, Mónica A. Silva, Steve Slater, Jeff Smith, Grigori Tertitski, JF Therrien, Kasper Thorup, Lee Tibbitts, Brian Uher-Koch, Rob van Bemmelen, David Ward, Martin Wikelski, and David Yurkowski.
See all pages that use this dataset
Note: While we identify the data sets used in these visualizations, we do not store any further details, nor the data sets themselves on our site.
Used as a Source In
- ID: 14221
![Universal Production Music: Home To You by William Baxter Noon [PRS], Pluck Up Courage by John Griggs [PRS], Philip Michael Guyler [PRS], Wafer Thin by Adam Leslie Gock [APRA], Dinesh David Wicks [APRA], Mitchell Stewart [APRA], The Magpie's Pie by Quentin Bachelet [SACEM], Romain Sanson [SACEM], Ticking Tension by Quentin Bachelet [SACEM], Romain Sanson [SACEM], Reward Drawer by Ehren Ebbage [BMI] Additional images courtesy of Alaska Satellite Facility - University of Alaska FairbanksThis video can be freely shared and downloaded. While the video in its entirety can be shared without permission, some individual imagery provided by ASF is obtained through permission and may not be excised or remixed in other products. For more information on NASA’s media guidelines, visit https://www.nasa.gov/multimedia/guidelines/index.htmlComplete transcript available.](/vis/a010000/a014200/a014221/ABoVE_Title.jpg) Produced Video
Produced Video - ID: 13756
 Produced Video