A newer version of this visualization is available.
Ocean Flows under the Pine Island Glacier, Antarctica
This visualization shows the ocean currents circulating around the Pine Island Bay and flowing under the Pine Island Glacier.
Glaciers surrounding the Amundsen Sea in Antarctica have been rapidly melting. As glaciers flow out from land to the ocean, large expanses of ice behind their leading edges float on the seawater. The point on a glacier where it first loses contact with land is called the grounding line. Nearly all glacier melt occurs on the underside of the glacier beyond the grounding line, on the section floating on seawater as the warmer ocean currents erode the base of the floating ice.
This visualization shows the ocean currents in the Amundsen Sea derived from the "Estimating the Circulation and Climate of the Ocean" (ECCO) ocean circulation model. The visualization approaches the Pine Island Glacier, dives beneath the water and views the ocean flows circulating beneath the floating ice. The surface of the ice sheet is exaggerated by 4x while the topography below sea level is exaggerated by 15x for the purpose of clarity.

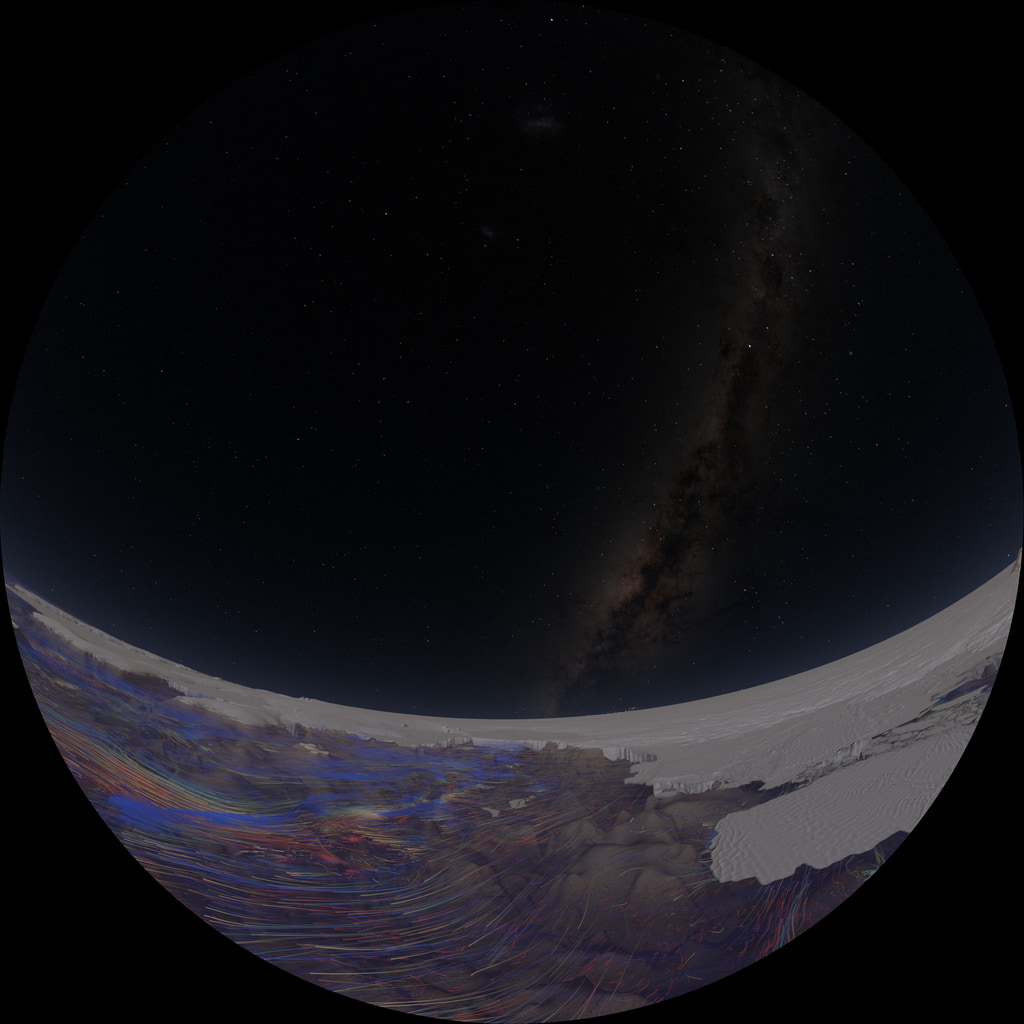
This image shows the ocean currents circulating in the Pine Island Bay.
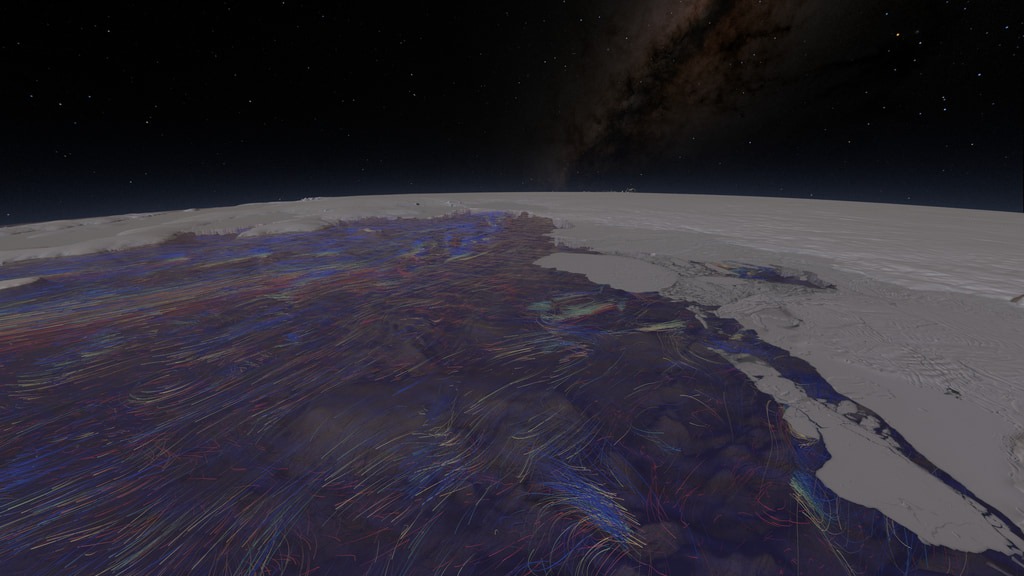
This image shows the ocean currents circulating in the water beneath the Pine Island Glacier.
Credits
Please give credit for this item to:
NASA's Scientific Visualization Studio
-
Visualizer
- Cindy Starr (Global Science and Technology, Inc.)
-
Data visualizers
- Horace Mitchell (NASA/GSFC)
- Greg Shirah (NASA/GSFC)
- Ernie Wright (USRA)
-
Project support
- Laurence Schuler (ADNET Systems, Inc.)
- Ian Jones (ADNET Systems, Inc.)
Release date
This page was originally published on Thursday, November 5, 2020.
This page was last updated on Wednesday, November 15, 2023 at 12:16 AM EST.
Datasets used in this visualization
-
ECCO3 High Resolution Ocean and Sea Ice Model
ID: 802 -
Mosaic of Amundsen Sea Embayment, Antarctica [Landsat 8: OLI]
ID: 1098An image mosaic comprised of 20 LandSat 8 tiles on the Amundsen Sea Embayment, Antarctica
Credit: Landsat 8 mission
See all pages that use this dataset -
BedMachine Antarctica V1
ID: 1099A self-consistent dataset of the Antarctic Ice Sheet based on the conservation of mass
Credit: Morlighem, M., Rignot, E., Binder, T. et al. Deep glacial troughs and stabilizing ridges unveiled beneath the margins of the Antarctic ice sheet. Nature Geoscience 13, 132–137 (2020)
See all pages that use this dataset -
REMA (Reference Elevation Model of Antarctica - 100m)
ID: 1110High resolution, time-stamped Digital Surface Model (DSM) of Antarctica at 100-meter spatial resolution
Credit: DEMs provided by the Byrd Polar and Climate Research Center and the Polar Geospatial. Computer time provided through a Blue Waters Innovation Initiative. DEMs produced using data from DigitalGlobe, Inc.
See all pages that use this dataset
Note: While we identify the data sets used in these visualizations, we do not store any further details, nor the data sets themselves on our site.
Newer Versions
- ID: 4885
- ID: 4888
Used as a Source In
- ID: 14116