An unexpectedly large count of trees in the West African Sahara and Sahel
Visualization showing study region, climate zones, close up of high res satellite data with machine learning-based tree crown regions, counting of trees, and overall tree counts and area
This video is also available on our YouTube channel.
This visualization shows “an unexpectedly large count of trees in the West African Sahara and Sahel” which is also the title of the paper published in the 14-Oct-2020 issue of NATURE. Dryer areas of the globe that do not have forests are sometimes discounted for their contribution to the global biome in climate models and other prediction systems. However, this research has shown that over 1.8 billion trees are in the small study area in the West African Sahara and Sahel.
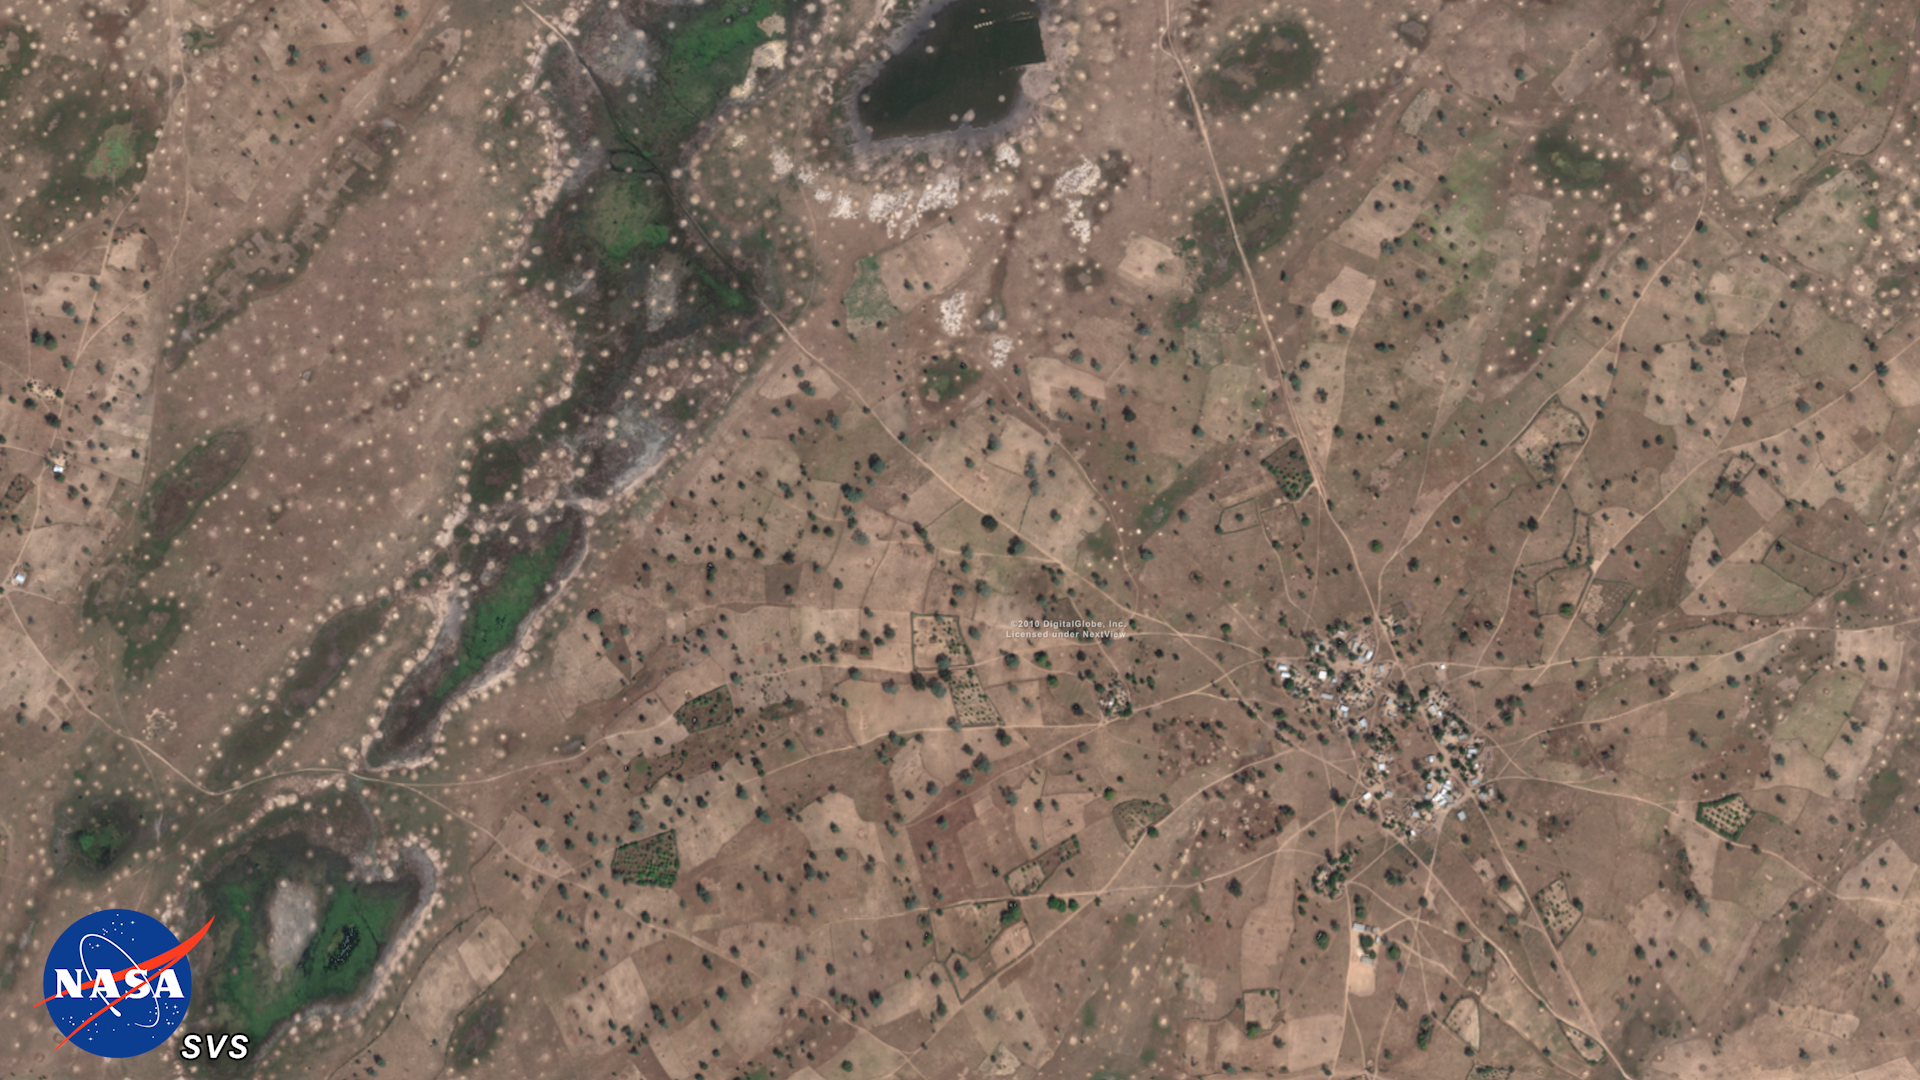
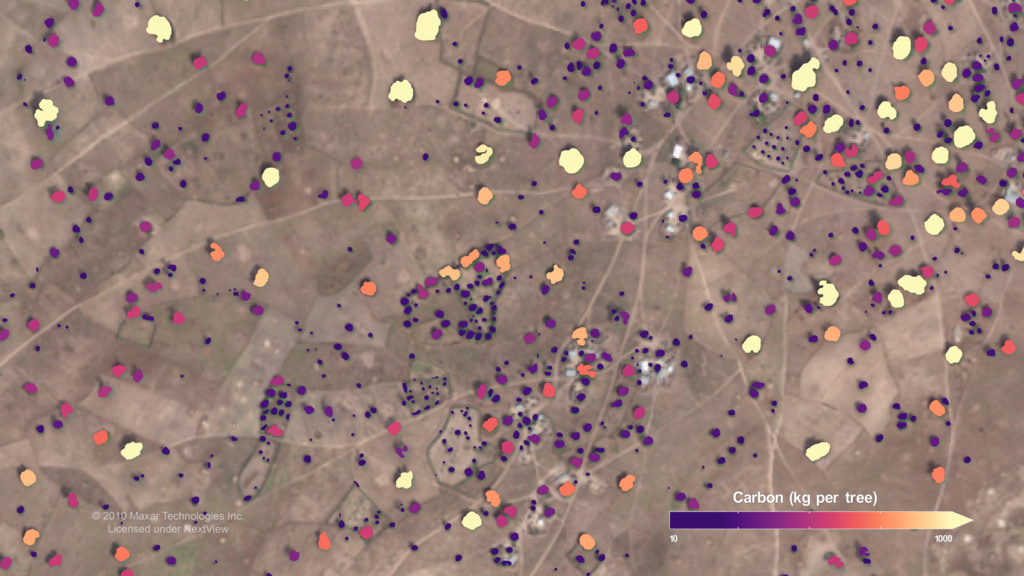
A deep learning algorithm was trained by the scientists to identify trees using very high resolution satellite imagery (0.5m per pixel) from DigitalGlobe. The algorithm identified trees by looking for appropriate colors and shadows cast. A total of 11,128 multispectral images were used to identify trees in this study region. Using this technique 1,837,565,501 trees were identified in the study region with a median tree crown area of 12 square meters.
The visualization starts at a global scale then pushes in to show the study area. To illustrate that this is a dry area, climate zones are shown using annual rainfall averages from 1982-2017 including regions that are:
- hyper-arid (0-150 mm rainfall/year)
- arid (150-300 mm/year)
- semi-arid (300-600 mm/year)
- sub-humid (600-1000 mm/year)
The visualization next shows an area of high resolution imagery of the trees, then overlays the results of the machine learning which are filled regions of tree crowns for each tree in view. The trees are then counted up. The areas of trees are also totaled using the tree crown regions. We then zoom back out to see the entire study area and the total tree count and area.
This is a success story in using deep learning and big data to perform large scale scientific analysis. Now, scientists know the number and size of these trees in the Sahara and the Sahel. They will be able to use this information to calculate their impact to our planet.
Visualization showing study region, climate zones, close up of high res satellite data with machine learning-based tree crown regions, counting of trees, and overall tree counts and area (with French annotations). The native language in Senegal is French

Climate zones in the study area including:
- hyper-arid (0-150 mm rainfall/year)
- arid (150-300 mm/year)
- semi-arid (300-600 mm/year)
- sub-humid (600-1000 mm/year)
Tree density per hectare for the study area
Colar bar for trees per hectare: 0 is dark gray, 20 is gray, 40 is light gray, 60 is light orange, and 80+ is red. This is the same color table used in the journal article.
Credits
Please give credit for this item to:
NASA's Scientific Visualization Studio
-
Visualizers
- Greg Shirah (NASA/GSFC)
- Lori Perkins (NASA/GSFC)
- Helen-Nicole Kostis (USRA)
- Leann Johnson (Global Science and Technology, Inc.)
-
Scientists
- Compton Tucker (NASA/GSFC)
- Martin Brandt (University of Copenhagen)
- Jérôme Chave (French National Center for Scientific Research)
-
Data provider
- Erin Glennie (SSAI)
-
Technical support
- Ian Jones (ADNET Systems, Inc.)
- Laurence Schuler (ADNET Systems, Inc.)
Release date
This page was originally published on Friday, October 16, 2020.
This page was last updated on Sunday, April 21, 2024 at 12:15 AM EDT.
Papers used in this visualization
Datasets used in this visualization
-
BMNG (Blue Marble: Next Generation) [Terra and Aqua: MODIS]
ID: 508Credit: The Blue Marble data is courtesy of Reto Stockli (NASA/GSFC).
This dataset can be found at: http://earthobservatory.nasa.gov/Newsroom/BlueMarble/
See all pages that use this dataset -
WorldView-2 © 2010 DigitalGlobe
ID: 996 -
Band Combination 4-3-2 [Landsat-8: OLI/TIRS]
ID: 1086 -
OpenStreetMap
ID: 1088City lon/lat names and locations
See all pages that use this dataset -
Rasterized Tree Crowns (generated via ML from DigitalGlobe mosaics)
ID: 1095 -
Tree Locations (generated via ML from DigitalGlobe mosaics)
ID: 1096 -
Tree Densities (generated via ML from DigitalGlobe mosaics)
ID: 1097
Note: While we identify the data sets used in these visualizations, we do not store any further details, nor the data sets themselves on our site.
Related
- ID: 5031
Used as a Source In
- ID: 13736