Ocean Flow Vignettes
Ocean flows off the East coast of the United States
This video is also available on our YouTube channel.
This is a collection of visualizations of ocean flows created in support of NASA's 2020 sea level rise campaign. There are 5 regions of focus:
• central Pacific
• central Atlantic
• southeast Asia
• US east coast
• US west coast
The span of time shown in each visualization is about 10 months. The data used for each visualization comes from the ECCO-2 ocean model using data from 2010-01-15T00:12:58 to 2010-11-22T11:10:31. Each frame of the animation is approximately 2 hours apart.
Ocean flows off the west coast of the United States
This video is also available on our YouTube channel.
Ocean flows around southeast Asia
This video is also available on our YouTube channel.
Ocean fows in the Altantic ocean
This video is also available on our YouTube channel.
Ocean flows in the Pacific ocean
This video is also available on our YouTube channel.
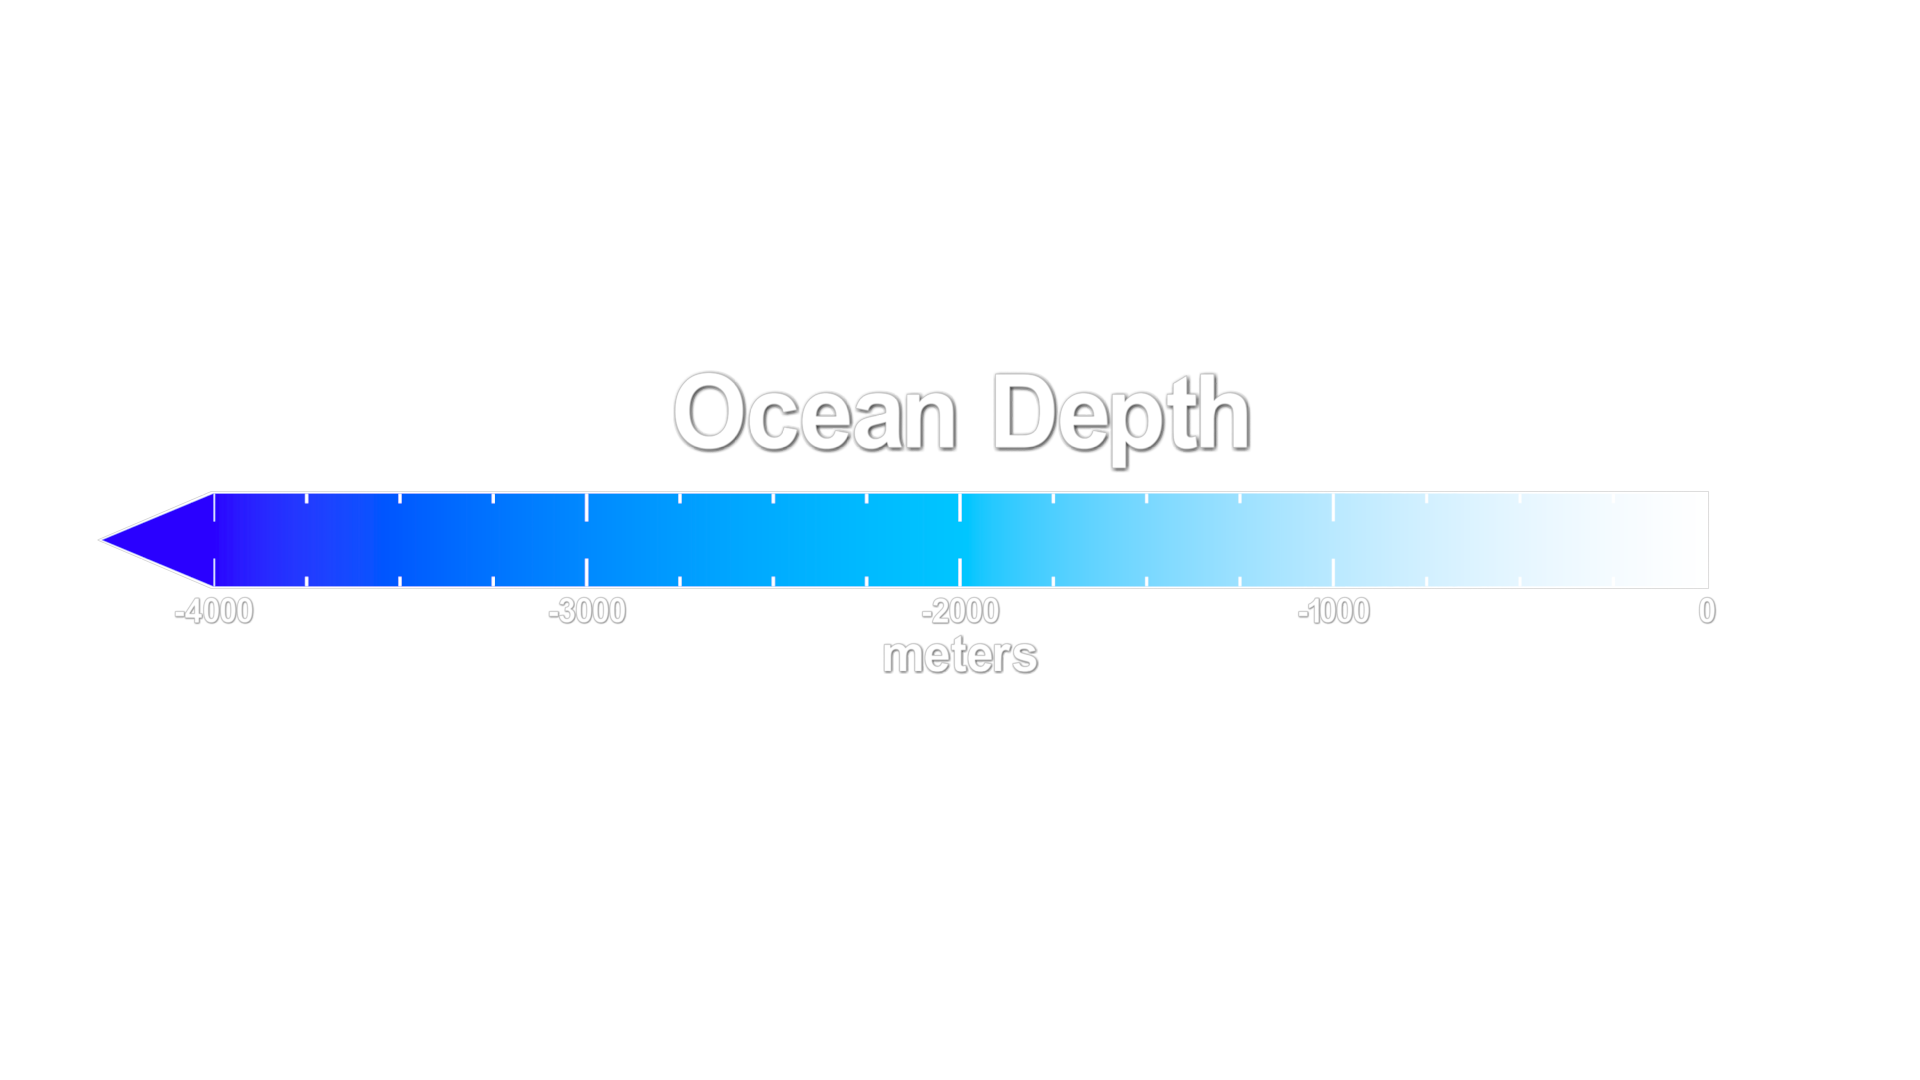
Ocean depth colorbar from white at the surface to cyan at 2000 meters deep to blue at 4000 meters deep
Credits
Please give credit for this item to:
NASA's Scientific Visualization Studio
-
Visualizers
- Greg Shirah (NASA/GSFC)
- Horace Mitchell (NASA/GSFC)
-
Technical support
- Laurence Schuler (ADNET Systems, Inc.)
- Ian Jones (ADNET Systems, Inc.)
Release date
This page was originally published on Thursday, November 5, 2020.
This page was last updated on Sunday, January 14, 2024 at 12:28 AM EST.
Series
This visualization can be found in the following series:Datasets used in this visualization
-
ECCO2 (ECCO2 High Resolution Ocean and Sea Ice Model)
ID: 707 -
ETOPO1 Global Relief Model (NOAA National Centers for Environmental Information/ETOPO1 Global Relief Model/Grid Version: ETOPO1 Ice Surface)
ID: 1081Credit: NOAA National Centers for Environmental Information
See all pages that use this dataset
Note: While we identify the data sets used in these visualizations, we do not store any further details, nor the data sets themselves on our site.
Related
- ID: 13747
![Music: Rain over the Sea by Bruno Vouillon [SACEM]Complete transcript available.](/vis/a010000/a013700/a013747/Thumbnail0.jpg) Produced Video
Produced Video
Used as a Source In
- ID: 31168
 Hyperwall Visual