NASA captures Isaias over the U.S. East Coast
This data visualization shows Tropical Storm Isaias stretching across the United States East Coast on the morning of August 4th, 2020. This storm system caused major flooding and damage up and down the entire eastern seaboard.
This video is also available on our YouTube channel.
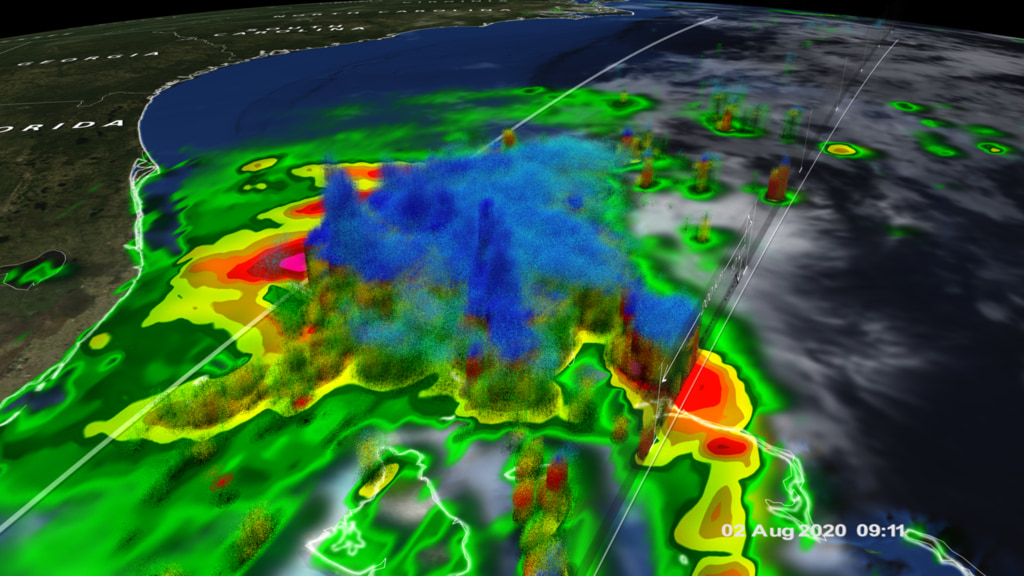
After regaining hurricane intensity over the Gulf Stream, Hurricane Isaias made landfall on the south coast of North Carolina on Monday August 3rd at 11:10 pm EDT near Ocean Isle Beach. This data visualization shows Isaias as is makes its way northward from the Bahamas to the coast of North Carolina using NASA’s IMERG rainfall product. With IMERG, precipitation estimates from the GPM core satellite are used to calibrate precipitation estimates from microwave and IR sensors on other satellites to produce half-hourly precipitation maps at 0.1 degrees horizontal resolution. After making landfall, Isaias continued tracking northward over eastern North Carolina in response to a large upper-level trough located over the eastern half of the US.
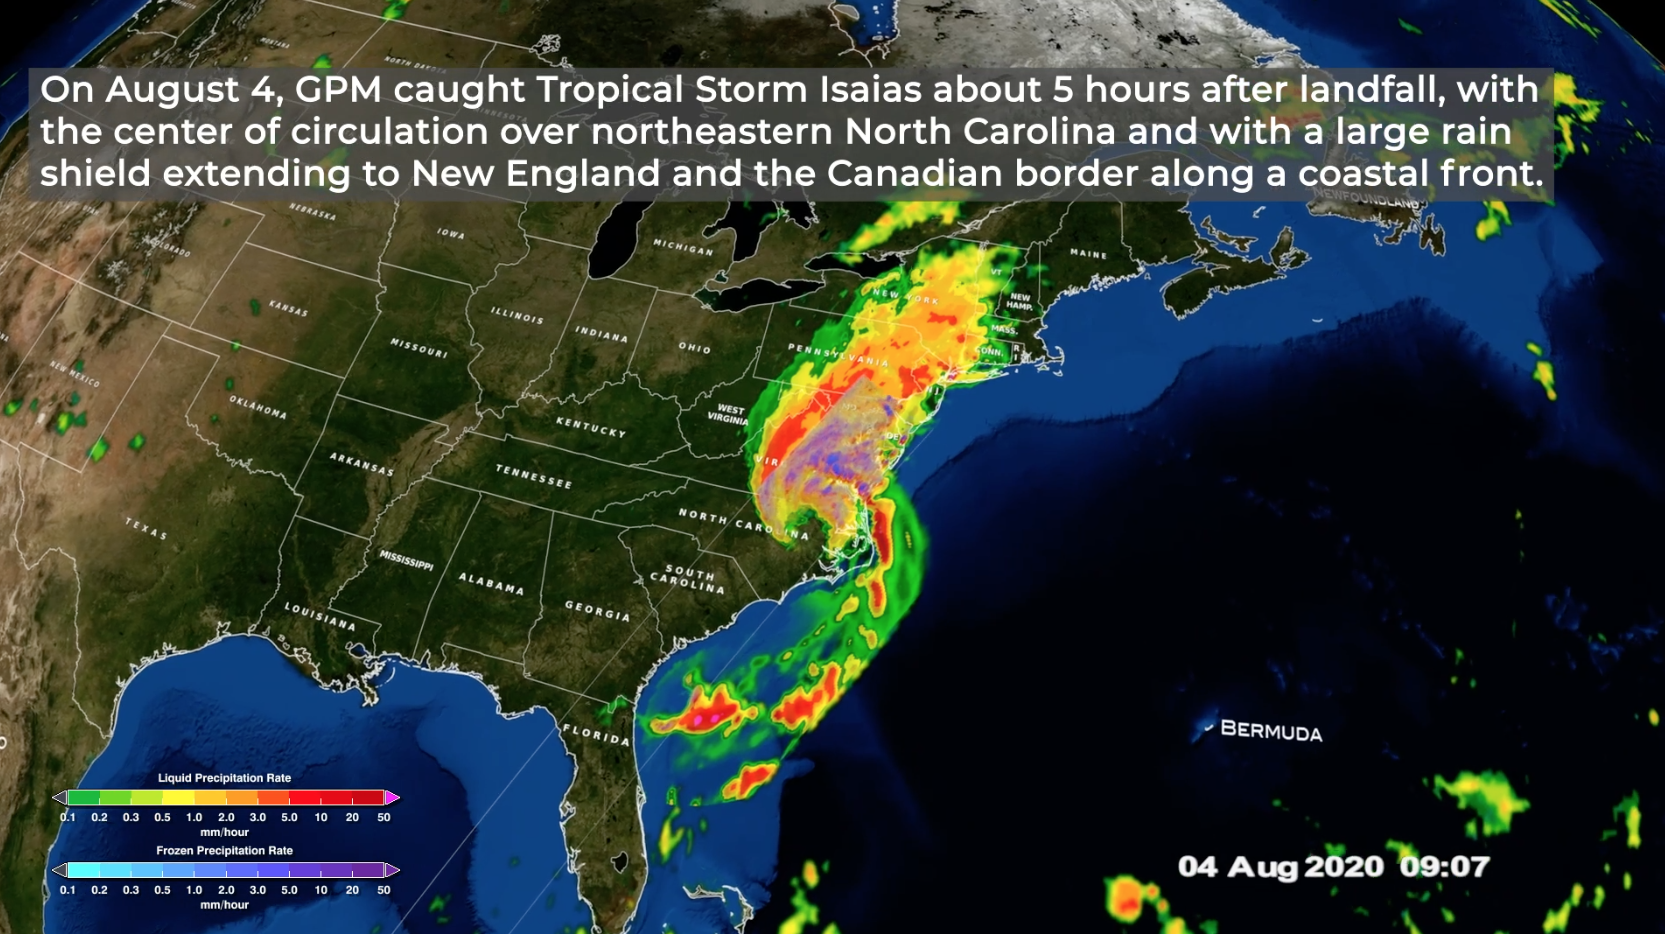
It was at this time that Isaias was again overflown by the GPM core satellite at 8:51 UTC (4:51 am EDT) on the morning of Tuesday August 4th, as shown in the second part of the data visualization. Here rainfall rates derived directly from the GPM Microwave Instrument (or GMI) and Dual-Polarization Radar (or DPR) provide a detailed look at Isaias, which at the time was still a strong tropical storm with sustained winds reported at 70 mph by the National Hurricane Center. GPM clearly shows the center of circulation over northeastern North Carolina, which at the time was just southeast of Roanoke Rapids, NC, with a large eye that is open on the southern side. Amazingly, despite the center being located down in North Carolina, GPM shows a large rain shield extending from North Carolina all the way into New England to the Canadian border as a result of the storm’s counterclockwise circulation drawing abundant moisture off the Atlantic and over land where the combination of an old frontal boundary and the Appalachian terrain squeeze out this moisture to form large amounts of precipitation ahead of the storm, which is then drawn further northward by southerly flow aloft from the upper-level trough.
GPM data is archived at https://pps.gsfc.nasa.gov/

Color bar for frozen precipitation rates (ie, snow rates). Shades of cyan represent low amounts of frozen precipitation, whereas shades of purple represent high amounts of precipitation.
Color bar for liquid precipitation rates (ie, rain rates). Shades of green represent low amounts of liquid precipitation, whereas shades of red represent high amounts of precipitation.
Credits
Please give credit for this item to:
NASA's Scientific Visualization Studio
-
Data visualizers
- Alex Kekesi (Global Science and Technology, Inc.)
- Greg Shirah (NASA/GSFC)
-
Scientists
- George Huffman (NASA/GSFC)
- Scott Braun (NASA/GSFC)
-
Producer
- Ryan Fitzgibbons (USRA)
-
Writer
- Stephen Lang (SSAI)
Release date
This page was originally published on Tuesday, August 4, 2020.
This page was last updated on Wednesday, November 15, 2023 at 12:16 AM EST.
Missions
This visualization is related to the following missions:Series
This visualization can be found in the following series:Datasets used in this visualization
-
Rain Rates (Surface Precipitation) [GPM: GMI]
ID: 822Credit: Data provided by the joint NASA/JAXA GPM mission.
See all pages that use this dataset -
Volumetric Precipitation data (Ku) [GPM: DPR]
ID: 830Credit: Data provided by the joint NASA/JAXA GPM mission.
See all pages that use this dataset -
IMERG
ID: 863This dataset can be found at: http://pmm.nasa.gov/sites/default/files/document_files/IMERG_ATBD_V4.4.pdf
See all pages that use this dataset
Note: While we identify the data sets used in these visualizations, we do not store any further details, nor the data sets themselves on our site.
Related
- ID: 4884
 Visualization
 - ID: 4846
Used as a Source In
- ID: 13681
 Produced Video