Greenland Ice Sheet: Three Futures
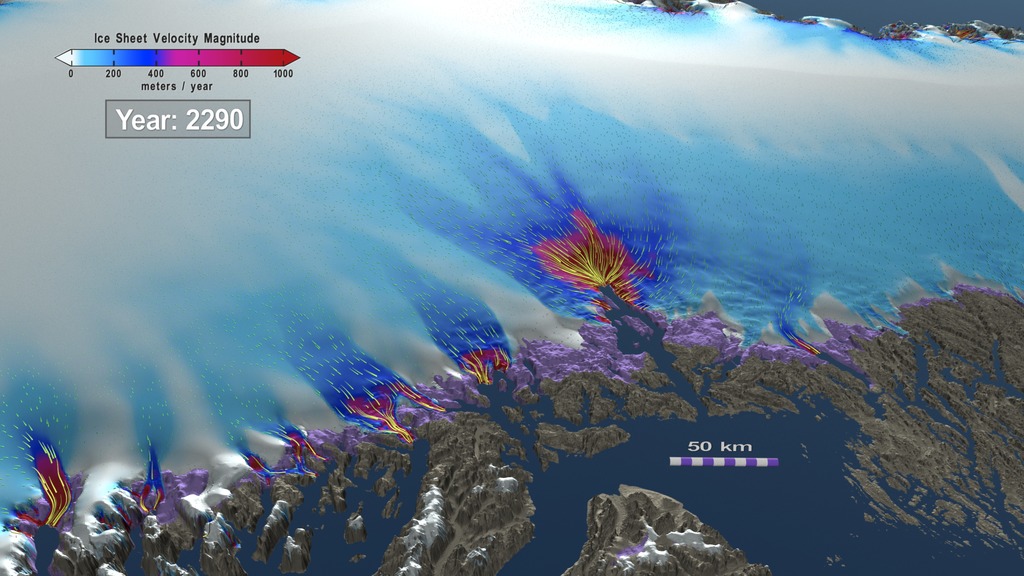
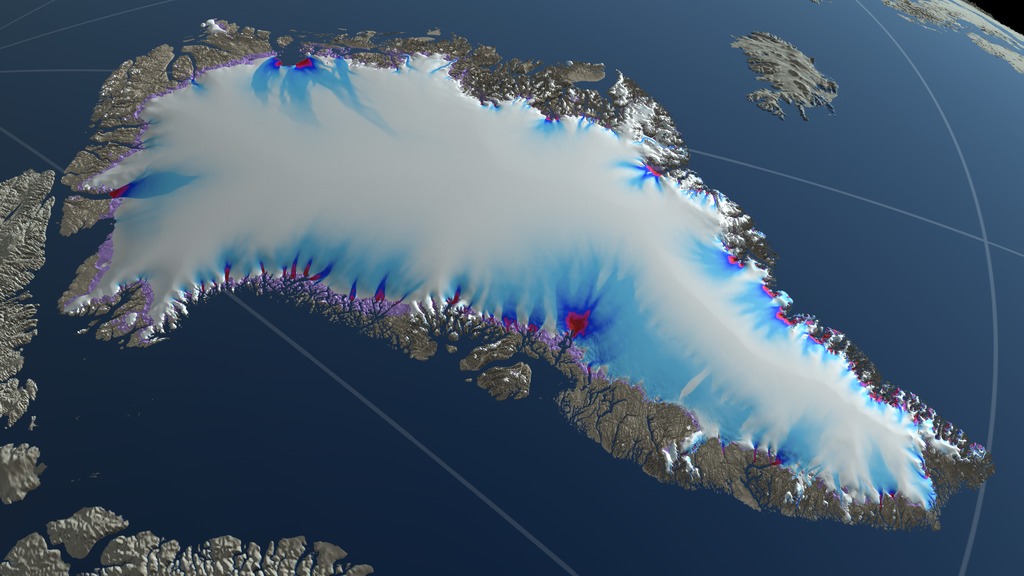
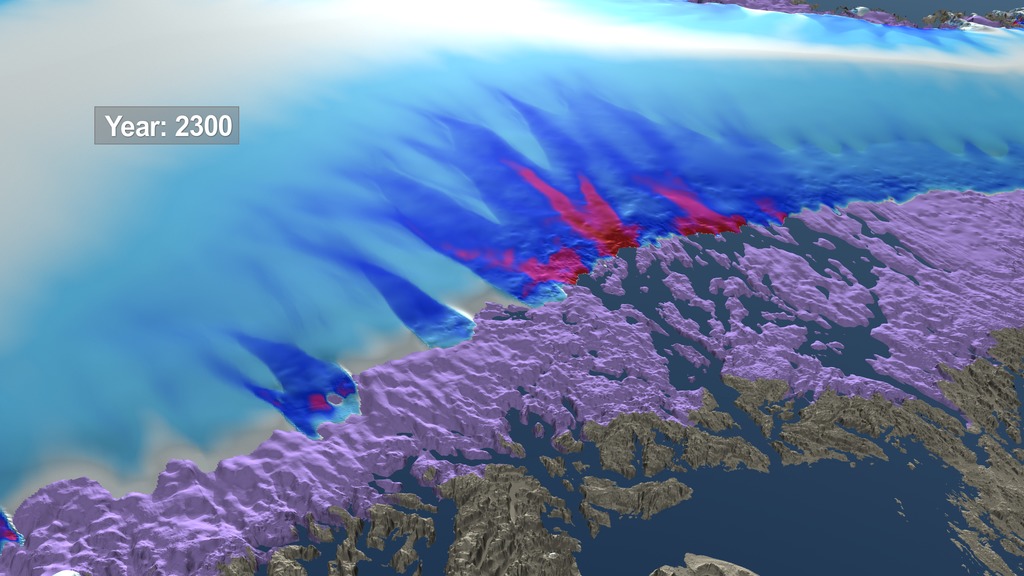
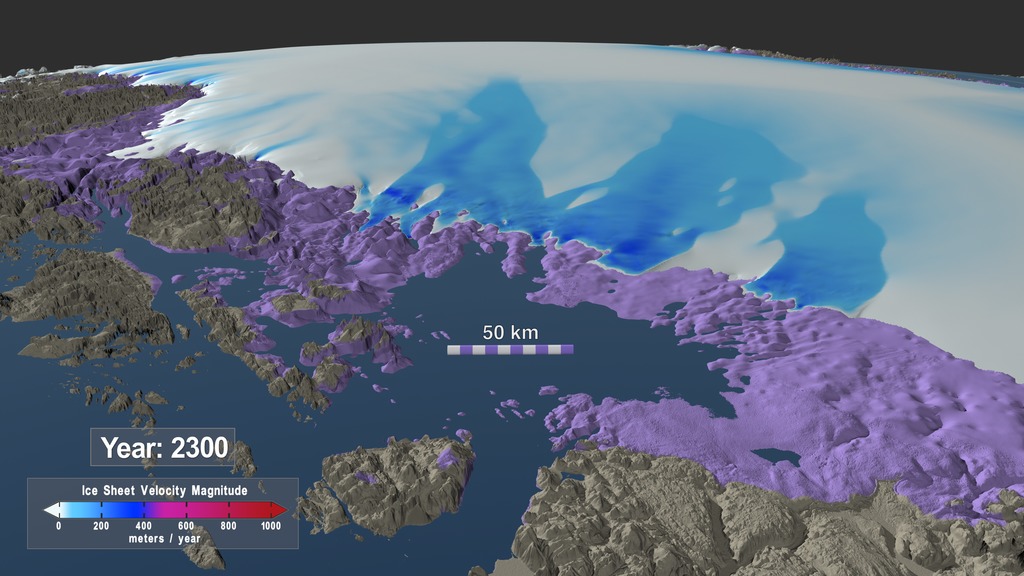
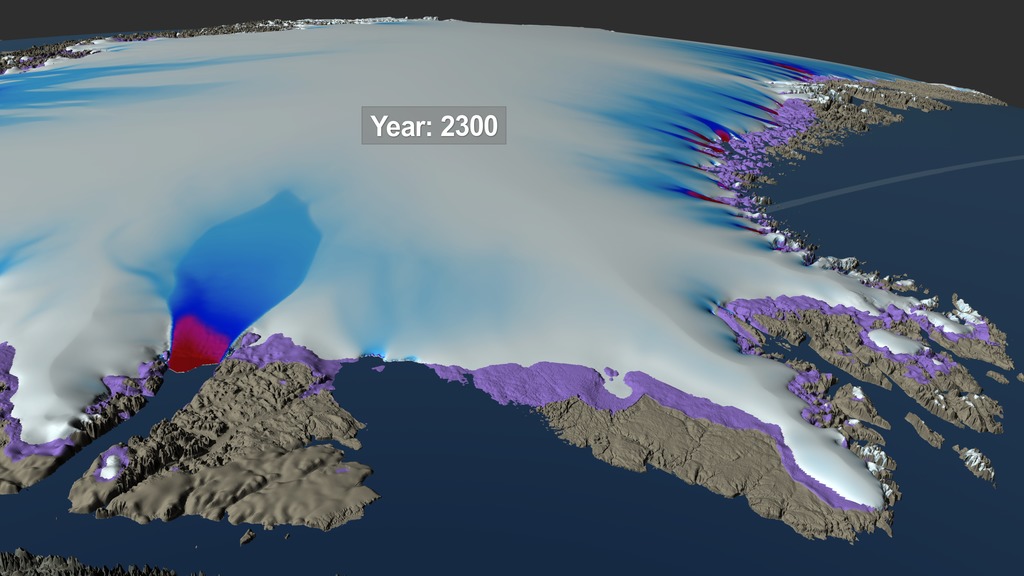
This movie shows the evolution of several regions of the Greenland Ice Sheet between 2008 and 2300 based on three different climate scenarios. Each scenario reflects a potential future climate outcome based on current and future greenhouse gas emmisions. The regions shown in a violet color are exposed areas of the Greenland bed that were covered by the ice sheet in 2008.
The Greenland Ice Sheet holds enough water to raise the world’s sea level by over 7 meters (23 feet). Rising atmosphere and ocean temperatures have led to an ice loss equivalent to over a centimeter increase in global mean sea-level between 1991 and 2015. Large outlet glaciers, rivers of ice moving to the sea, drain the ice from the interior of Greenland and cause the outer margins of the ice sheet to recede. Improvements in measuring the ice thickness in ice sheets is enabling better simulation of the flow in outlet glaciers, which is key to predicting the retreat of ice sheets into the future.
Recently, a simulation of the effects of outlet glacier flow on ice sheet thickness coupled with improved data and comprehensive climate modeling for differing future climate scenarios has been used to estimate Greenland’s contribution to sea-level over the next millennium. Greenland could contribute 5–34 cm (2-13 inches) to sea-level by 2100 and 11–162 cm (4-64 inches) by 2200, with outlet glaciers contributing 19–40 % of the total mass loss. The analysis shows that uncertainties in projecting mass loss are dominated by uncertainties in climate scenarios and surface processes, followed by ice dynamics. Uncertainties in ocean conditions play a minor role, particularly in the long term. Greenland will very likely become ice-free within a millennium without significant reductions in greenhouse gas emissions.
This movie shows the evolution of several regions of the Greenland Ice Sheet between 2008 and 2300 based on three different climate scenarios. Each scenario reflects a potential future climate outcome based on current and future greenhouse gas emissions. The scenario labelled "LOW" here is based on the Representative Concentration Pathway (RCP) 2.6 climate scenario while the one labelled "MEDIUM" is based on RPC 4.6. The visualization labelled "HIGH" is based on RPC 8.5 and reflects the current trajectory of emissions in the 21st century. The regions shown in a violet color are exposed areas of the Greenland bed that were covered by the ice sheet in 2008.
The data sets used for these animations are the control (“CTRL”) simulations and were produced with the open-source Parallel Ice Sheet Model . All data sets for this study are publicly available at the NSF Arctic Data Center

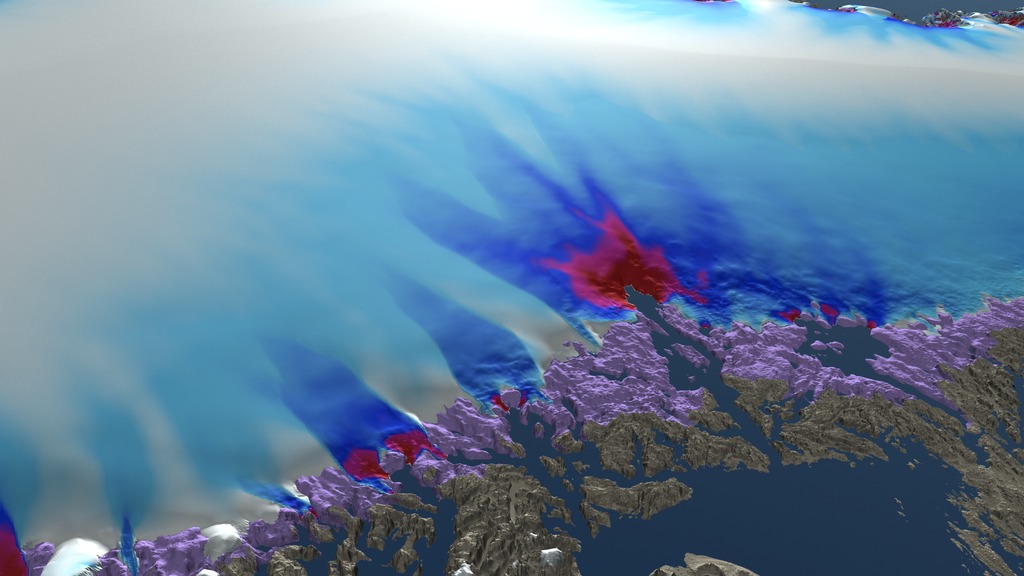
This high resolution image shows the simulated shape of the northeastern region of the Greenland Ice Sheet in the year 2300 under three different climate scenarios. The left side shows a low emission scenario, the middle image shows a medium emission scenario and the image on the right side shows a high emission scenario. Area shown in a violet color represents the exposed region of the Greenland bed that was covered by the ice sheet in 2008.
This high resolution image shows the simulated shape of the northwestern region of the Greenland Ice Sheet in the year 2300 under three different climate scenarios. The left side shows a low emission scenario, the middle image shows a medium emission scenario and the image on the right side shows a high emission scenario. Area shown in a violet color represents the exposed region of the Greenland bed that was covered by the ice sheet in 2008.
This high resolution image shows the simulated shape of the Jakobshavn region of the Greenland Ice Sheet in the year 2300 under three different climate scenarios. The left side shows a low emission scenario, the middle image shows a medium emission scenario and the image on the right side shows a high emission scenario. Area shown in a violet color represents the exposed region of the Greenland bed that was covered by the ice sheet in 2008.
Credits
Please give credit for this item to:
NASA's Scientific Visualization Studio
-
Visualizer
- Cindy Starr (Global Science and Technology, Inc.)
-
Data visualizers
- Greg Shirah (NASA/GSFC)
- Horace Mitchell (NASA/GSFC)
-
Producer
- LK Ward (USRA)
-
Scientists
- Andy Aschwanden (Geophysical Institute, University of Alaska Fairbanks)
- Shfaqat Abbas Khan (DTU Space)
- Douglas Brinkerhoff (University of Montana)
- Mark Fahnestock (Geophysical Institute, University of Alaska Fairbanks)
- Regine Hock (Geophysical Institute, University of Alaska Fairbanks)
- Constantine Khroulev (Geophysical Institute, University of Alaska Fairbanks)
- Ruth Mottram (Danish Meteorological Institute)
- Martin Truffer (Geophysical Institute, University of Alaska Fairbanks)
-
Technical support
- Laurence Schuler (ADNET Systems, Inc.)
- Ian Jones (ADNET Systems, Inc.)
Release date
This page was originally published on Tuesday, October 13, 2020.
This page was last updated on Wednesday, November 15, 2023 at 12:15 AM EST.
Datasets used in this visualization
-
Contribution of the Greenland Ice Sheet to sea-level over the next millennium using Large Ensemble Simulations
ID: 1048
Note: While we identify the data sets used in these visualizations, we do not store any further details, nor the data sets themselves on our site.
Related
- ID: 4727
Sources
- ID: 4743
- ID: 4738
- ID: 4739
- ID: 4721
- ID: 4722