From Apollo Sites To The South Pole
Beginning on the near side of the Moon, with the Apollo sites marked, the view quickly moves to the South Pole and zooms in to show the changing illumination conditions there for an entire year.
The Apollo program landed six pairs of astronauts on the Moon between 1969 and 1972. All six landing sites are at low latitudes, near the equator. In this visualization, the Apollo sites are contrasted with the South Pole, an area with enormous potential for future exploration. Time passes as we zoom toward Shackleton crater at the South Pole, revealing illumination conditions quite different from those near the equator. While many craters remain in permanent shadow, some nearby mountains and ridges are in persistent sunshine, making them attractive candidates for solar power and long-term habitation.
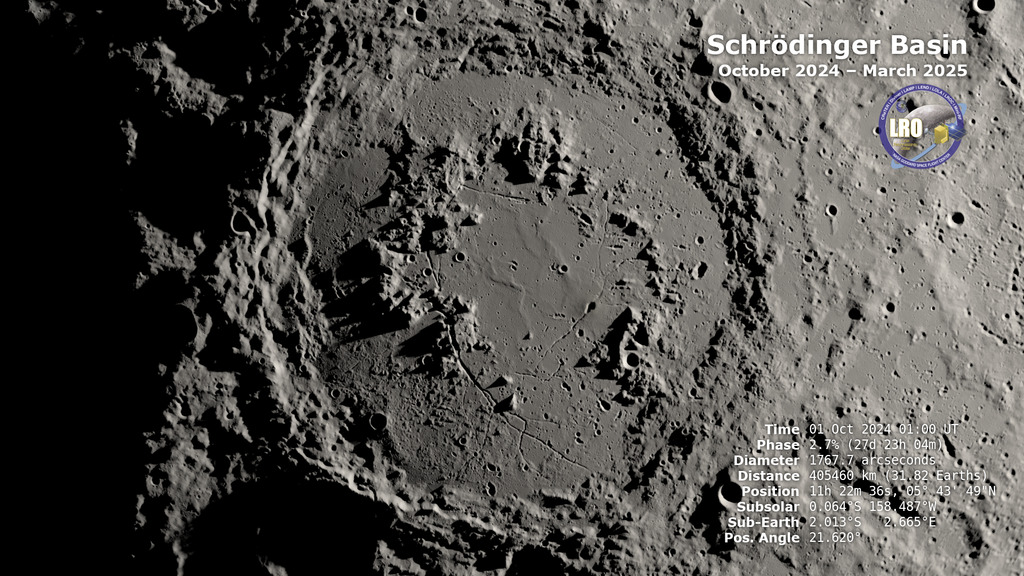
The remaining visualizations on this page show the illumination at the lunar South Pole throughout 2024, at several different scales. The year begins in the middle of South Pole summer, with the subsolar latitude near its greatest southern extent. As the year progresses, the shadows begin to deepen until mid-year and South Pole winter, when the subsolar latitude is at its northern extreme. The full range of the Sun's apparent motion in latitude is only about 3 degrees, versus 47 degrees on Earth, but this is enough to have a substantial effect on the amount of sunlight reaching the lunar poles.
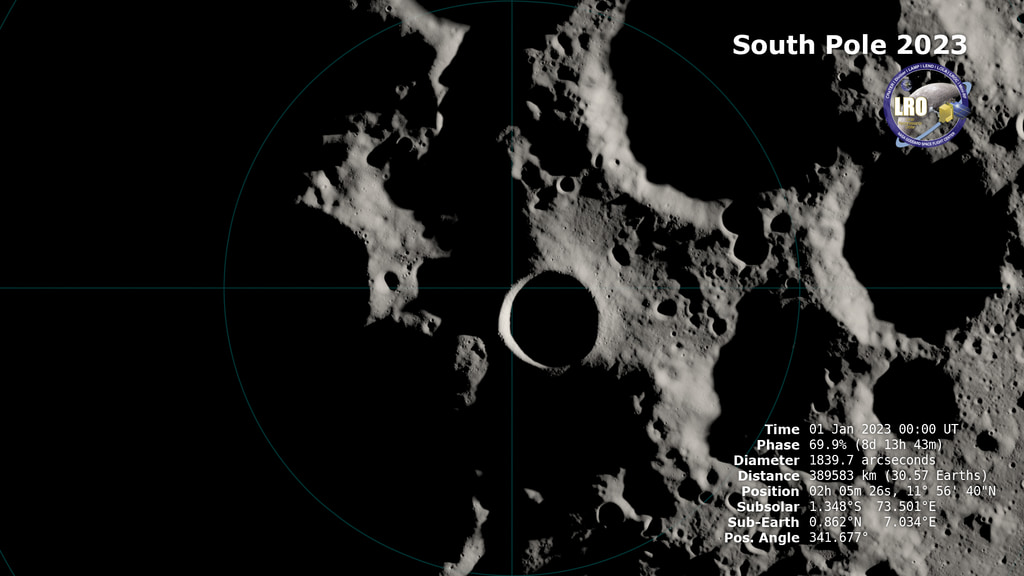
Illumination at the South Pole of the Moon for the year 2024, showing an area within 2 degrees of the pole. Available with and without annotations. Perspective projection: camera position (0, 0, −3rmoon), view direction (0, 0, 1), vertical field of view 2.00021°.
Closer view of the illuminaton at the South Pole of the Moon for the year 2024. This is cropped from the 4K frames of the previous animation group.
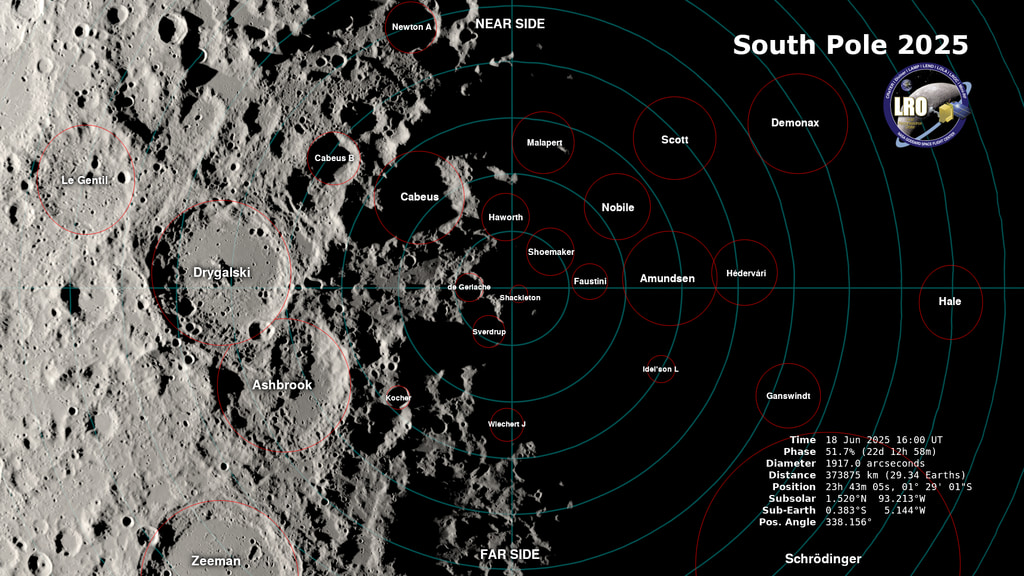
Illumination at the South Pole of the Moon for the year 2024, showing an area within 10 degrees of the pole. Major named craters are labeled and outlined. Available with and without annotations. Perspective projection: camera position (0, 0, −3rmoon), view direction (0, 0, 1), vertical field of view 10.06308°.

Illumination maps of the lunar South Pole. The shades of gray depict the amount of sunlight received during 2024. The floors of many of the craters receive no sunlight at all — they're permanently shadowed. Conversely, a small number of high spots on mountains and crater rims are in persistent sunshine. These were made by integrating (adding together) the frames of the above visualizations.
Credits
Please give credit for this item to:
NASA's Scientific Visualization Studio
-
Visualizer
- Ernie Wright (USRA)
-
Scientist
- Noah Petro (NASA/GSFC)
-
Technical support
- Laurence Schuler (ADNET Systems, Inc.)
- Ian Jones (ADNET Systems, Inc.)
Release date
This page was originally published on Monday, July 20, 2020.
This page was last updated on Wednesday, November 15, 2023 at 12:13 AM EST.
Datasets used in this visualization
-
DEM (Digital Elevation Map) [LRO: LOLA]
ID: 653 -
LROC WAC Color Mosaic (Natural Color Hapke Normalized WAC Mosaic) [Lunar Reconnaissance Orbiter: LRO Camera]
ID: 1015This natural-color global mosaic is based on the 'Hapke normalized' mosaic from LRO's wide-angle camera. The data has been gamma corrected, white balanced, and range adjusted to more closely match human vision.
See all pages that use this dataset
Note: While we identify the data sets used in these visualizations, we do not store any further details, nor the data sets themselves on our site.
Related
- ID: 5029
 Visualization
 - ID: 5027
- ID: 4930
 Visualization
Used as a Source In
- ID: 13814
 Produced Video