GPM observes Hurricane Dorian over the Bahamas
Hurricane Dorian on September 1, 2019 (21:22 UTC) over Abaco Island in The Bahamas
This video is also available on our YouTube channel.
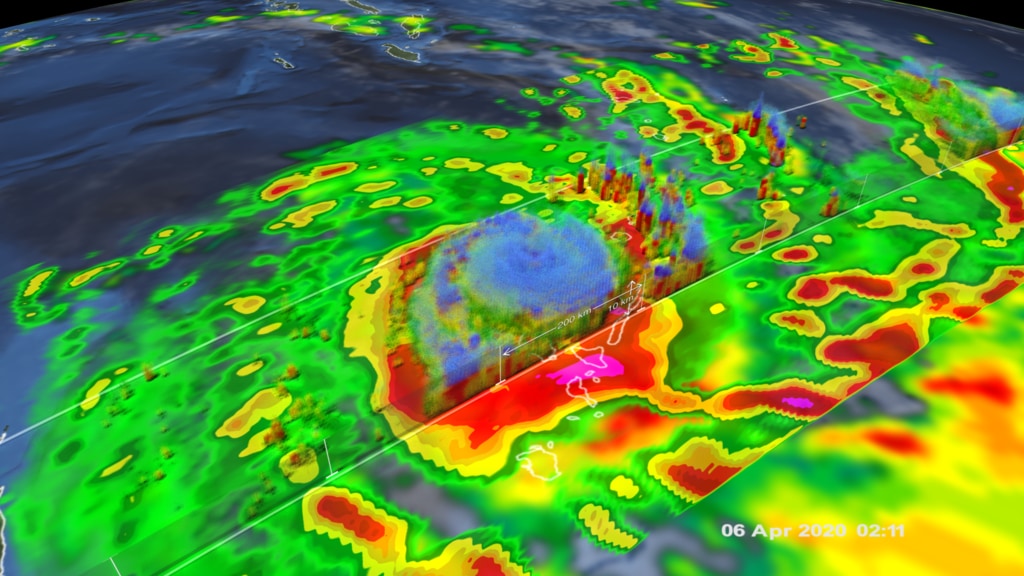
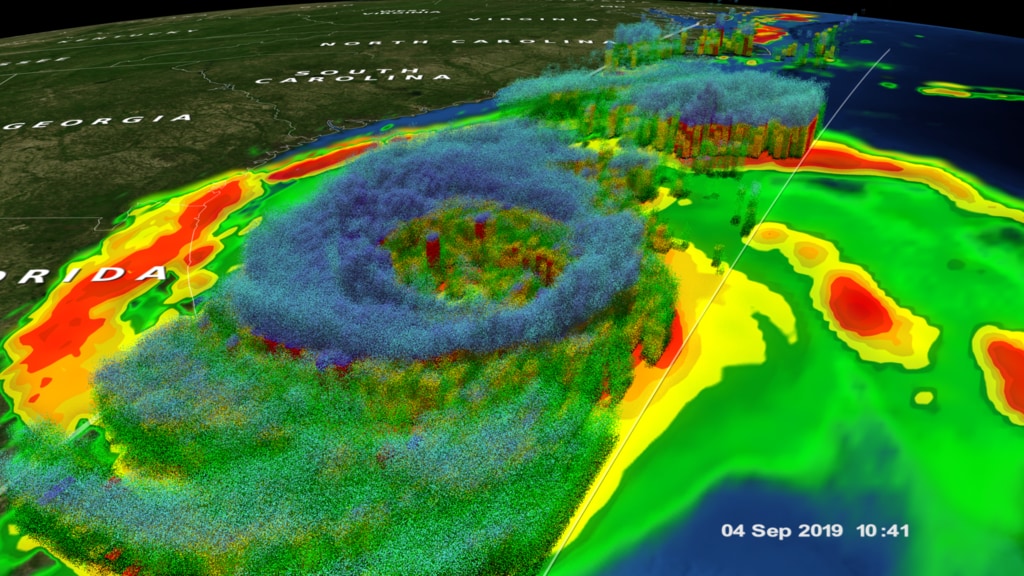
The Global Precipitation Measurement (GPM) Core Observatory captured these images of Hurricane Dorian on September 1st (21:22 UTC) as the storm was directly over Abaco Island in The Bahamas. At that time, the storm was a category 5 hurricane with maximum sustained winds of 185 mph (295 km/h) with gusts over 200 mph.

Print resolution image of Hurricane Dorian on September 1, 2019 (21:22 UTC) over Abaco Island in The Bahamas
Print resolution image of Hurricane Dorian on September 1, 2019 (21:22 UTC) over Abaco Island in The Bahamas
Print resolution image of Hurricane Dorian on September 1, 2019 (21:22 UTC) over Abaco Island in The Bahamas
Color bar for liquid precipitation rates (ie, rain rates). Shades of green represent low amounts of liquid precipitation, whereas shades of red represent high amounts of precipitation.
Color bar for frozen precipitation rates (ie, snow rates). Shades of cyan represent low amounts of frozen precipitation, whereas shades of purple represent high amounts of precipitation.
Credits
Please give credit for this item to:
NASA's Scientific Visualization Studio
-
Data visualizers
- Kel Elkins (USRA)
- Greg Shirah (NASA/GSFC)
- Alex Kekesi (Global Science and Technology, Inc.)
-
Scientists
- George Huffman (NASA/GSFC)
- Dalia B Kirschbaum (NASA/GSFC)
- Gail Skofronick Jackson (NASA/GSFC)
Release date
This page was originally published on Tuesday, September 3, 2019.
This page was last updated on Wednesday, November 15, 2023 at 12:13 AM EST.
Missions
This visualization is related to the following missions:Series
This visualization can be found in the following series:Datasets used in this visualization
-
CPC (Climate Prediction Center) Cloud Composite
ID: 600Global cloud cover from multiple satellites
See all pages that use this dataset -
Rain Rates (Surface Precipitation) [GPM: GMI]
ID: 822Credit: Data provided by the joint NASA/JAXA GPM mission.
See all pages that use this dataset -
Volumetric Precipitation data (Ku) [GPM: DPR]
ID: 830Credit: Data provided by the joint NASA/JAXA GPM mission.
See all pages that use this dataset -
IMERG
ID: 863This dataset can be found at: http://pmm.nasa.gov/sites/default/files/document_files/IMERG_ATBD_V4.4.pdf
See all pages that use this dataset
Note: While we identify the data sets used in these visualizations, we do not store any further details, nor the data sets themselves on our site.
Related
- ID: 4812
 Visualization
 - ID: 4753
 Visualization