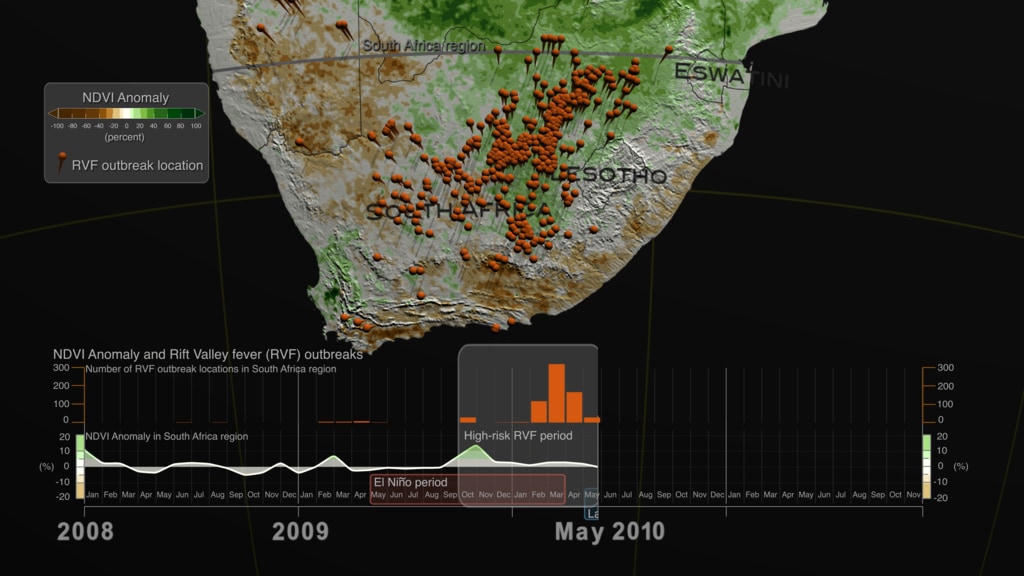
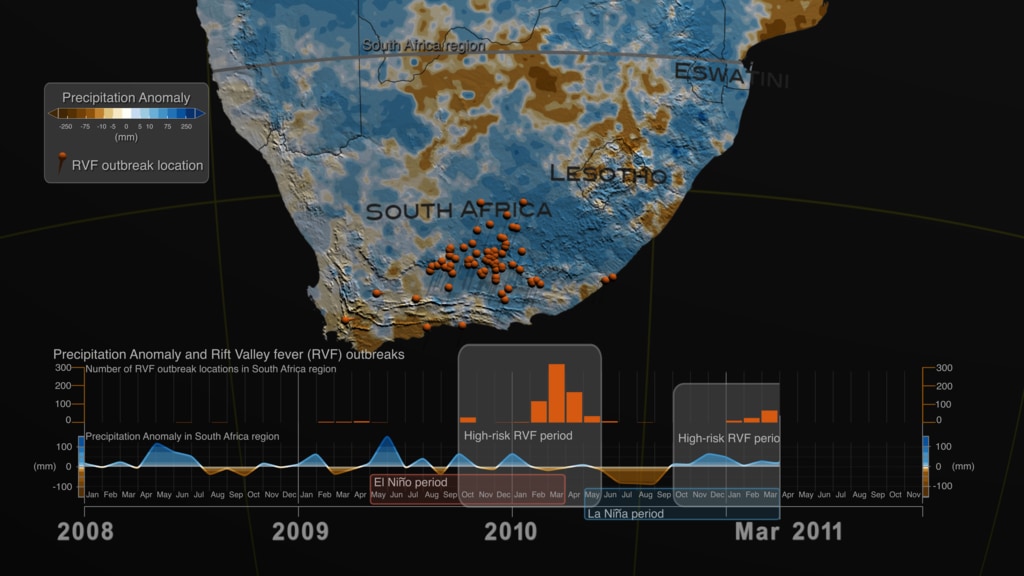
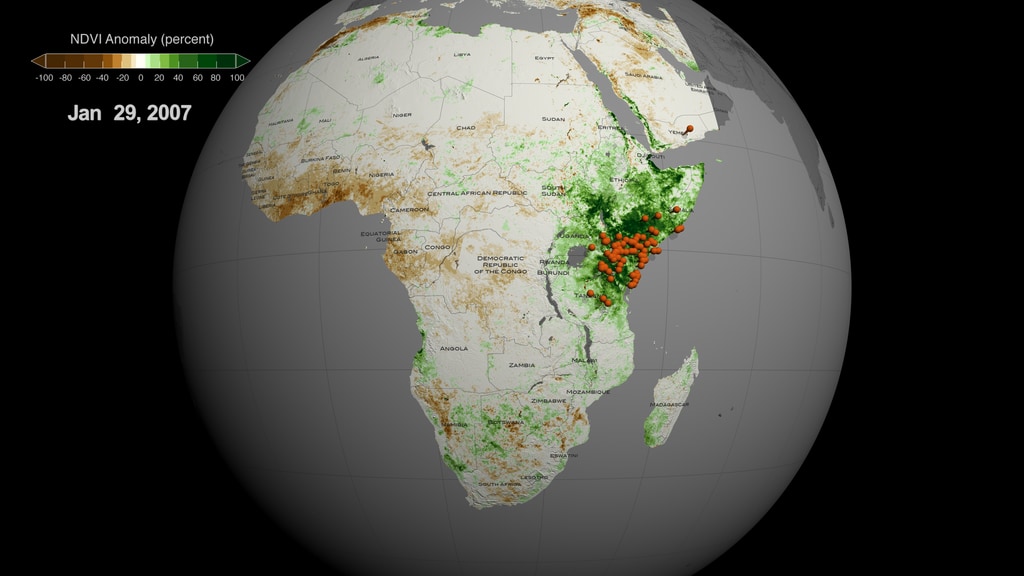
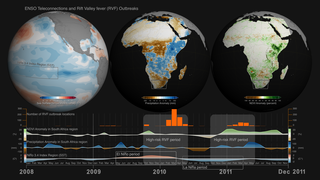
Vegetation index anomalies and Rift Valley fever (RVF) outbreaks in South Africa during 2009-2011
This visualization shows the relationship between vegetation index anomalies (Normalized Difference Vegetation Index - NDVI) data and outbreak locations of Rift Valley fever (RVf) during 2008 and 2011. The sequence starts in 2007 looking at the entire continent of Africa and zooms in the region of South Africa slowly to take a closer look at the above normal vegetation (green) and RVF outbreak locations (orange pins). Frames are provided in 4K resolution.
During the period of 2009-2011, a series of Rift Valley fever (RVF) outbreaks occured in South Africa and neighboring countries. The visualization featured on this page showcases the relationship between increase in vegetation and the RVF outbreak events. The visualization starts in 2007 looking at the entire continent of Africa and zooms slowly to the region of South Africa, so that we can take a closer look at the outbreak locations. The data visualized in this animation are: a) Normalized Difference Vegetation Index (NDVI) over Africa and Middle East and b) locations of Rift Valley fever outbreaks (orange pins). We can see clearly a spike of RVF outbreaks during February-May 2010 and again during February-May 2011. These outbreaks are linked to El Niño-Southern Oscillation (ENSO) Teleconnections during the period of 2009-2011.
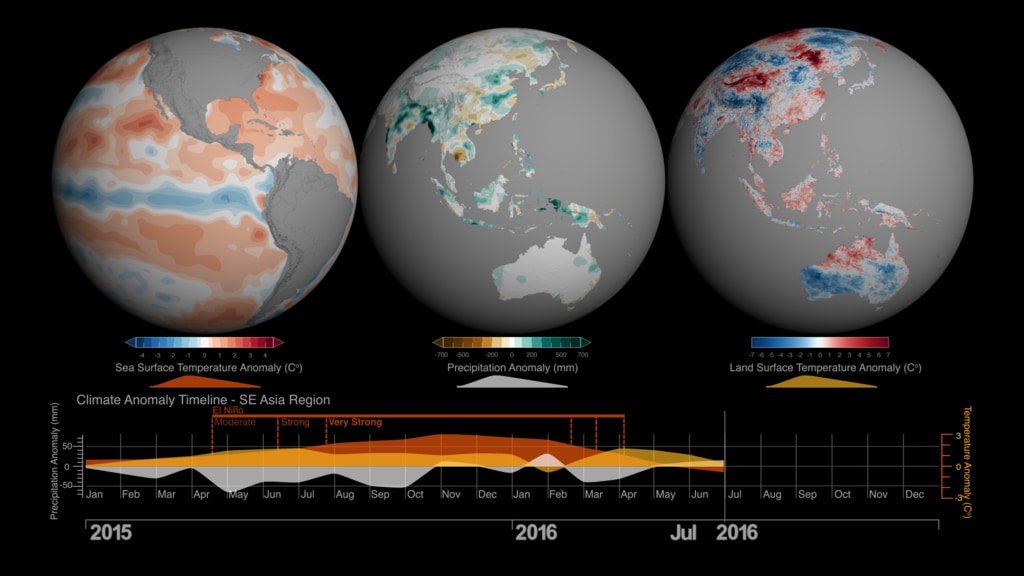
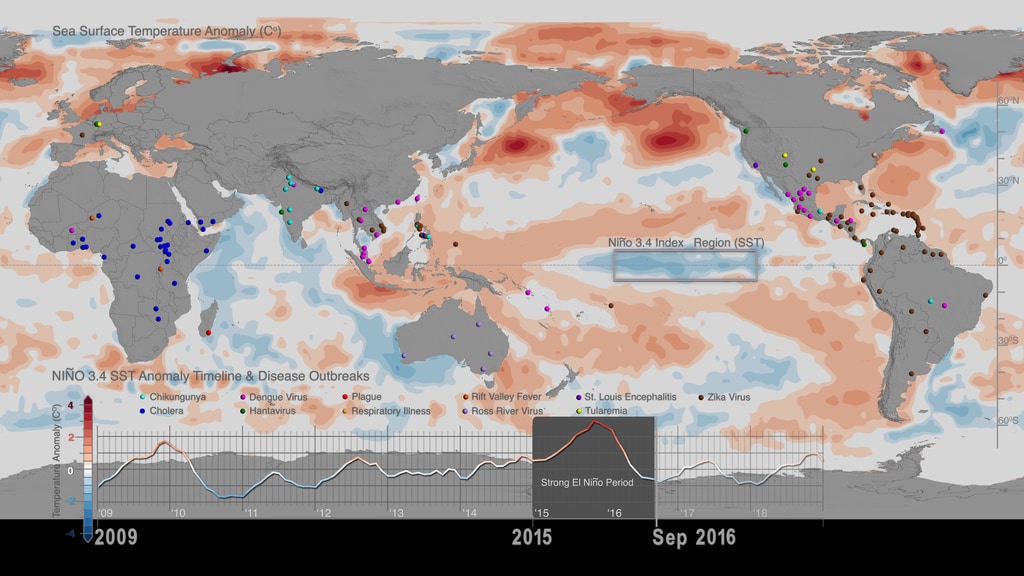
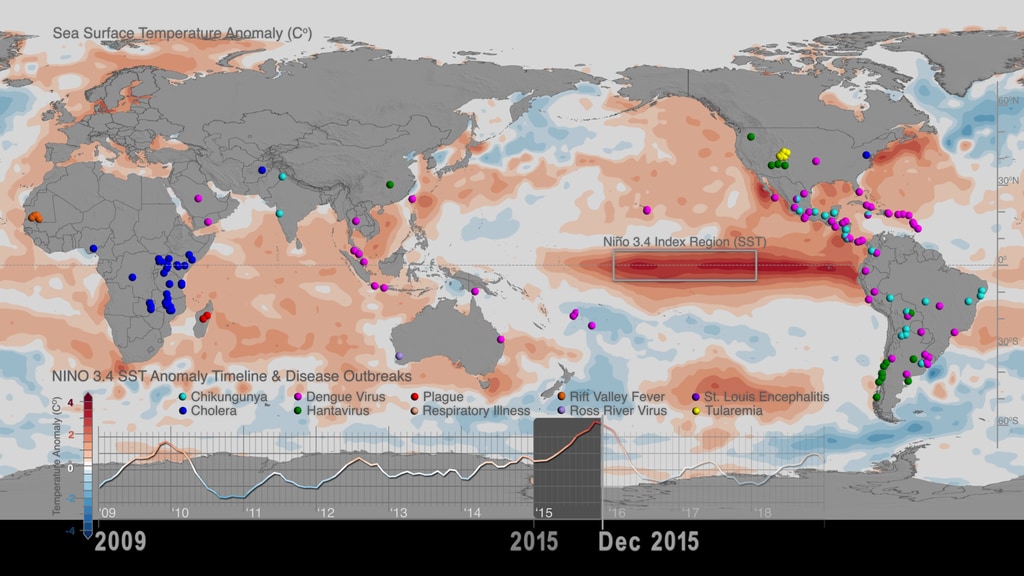
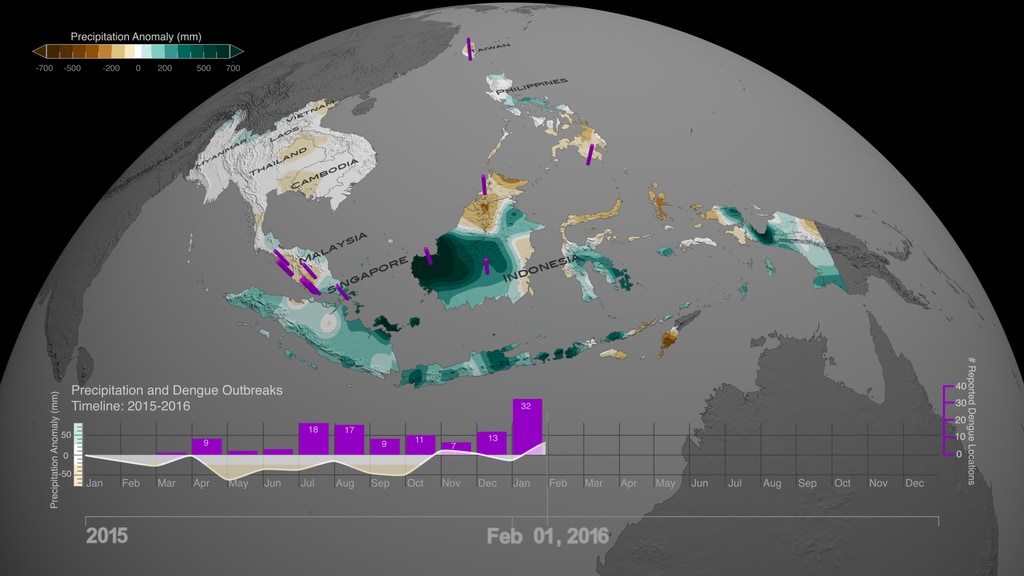
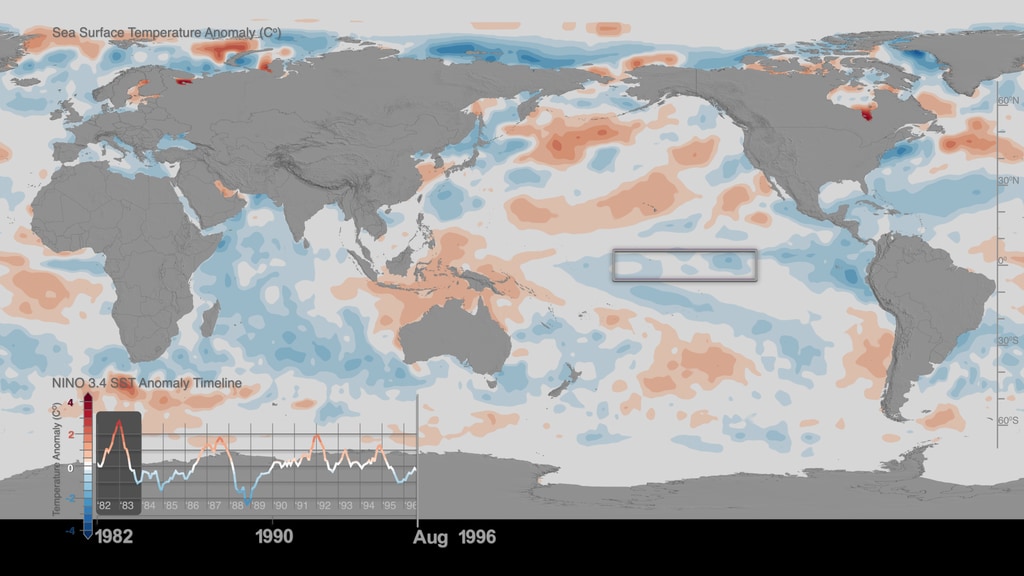
ENSO is an irregularly recurring climate pattern characterized by warmer (El Niño) and colder (La Niña) than usual ocean temperatures in the equatorial Pacific, which creates a ripple effect of anticipated weather changes in far-spread regions of our planet. Weather changes associated with the El Niño-Southern Oscillation phenomenon result in climate anomalies related to each other, such as rainfall, and vegetation anomaly conditions that trigger outbreaks of infectious diseases of public health concern in different regions around the world. These distant weather effects are called teleconnections. Therefore the effects of ENSO are called ENSO teleconnections, highlighting that warmer or colder than usual ocean temperatures in equatorial pacific with extents (5N-5S, 120W-170W) affect areas far from the source typically 2-3 months after. These relationships have been visualized with data for the region of South Africa in the entry ENSO Teleconnections and Rift Valley fever (RVF) Outbreaks.
During the last 20 years NASA scientist Dr. Assaf Anyamba and colleagues have been studying ENSO teleconnections by monitoring various climate datasets, among them Sea Surface Temperature and precipitation anomaly datasets from NASA and National Oceanic and Atmospheric Administration (NOAA) and vegetation data from NASA’s Earth Observing System Moderate Resolution Imaging Spectroradiometer (MODIS) instrument aboard the Terra (EOS AM-1) spacecraft. At the same time, the science team has been collecting, cataloguing and analyzing patterns and sources of disease outbreaks worldwide.
The relationship between ENSO induced anomalous rainfall and disease outbreaks is clearly illustrated by outbreak patterns of Rift Valley fever in South Africa. During the La Niña phase of ENSO, Southern Africa receives persistent and above normal rainfall, which floods habitats of RVF mosquito vectors triggering hatching of RVF virus infected eggs. The above-normal rainfall is followed by an increase in vegetation creating appropriate habitats for the mosquito vectors setting the stage for RVF outbreak activity, which in simple terms means an uptick in mosquito populations that cause infections of domestic livestock and human populations with the RVF virus. However, in rare cases there is a departure from this canonical response, as we can observe in 2009-2010 when a mild El Niño event resulted in above normal vegetaion and a significant RVF outbreak in central South Africa.
To learn more about the weather patterns, teleconnections and sequence of events, please see the following data visualizations:
- Precipitation Anomaly and Rift Valley fever (RVF) outbreaks in South Africa: 2008-2011
- Vegetation Index Anomalies and Rift Valley fever (RVF) outbreaks in South Africa region: 2008-2011
Data Sources:
- Disease Outbreak data were collected from the Program for Monitoring Emerging Diseases (ProMED) and the World Organisation for Animal Health/Organisation mondiale de la santé animale (OIE).
- Normalized Difference Vegetation Index (NDVI) dataset is derived from NASA’s Earth Observing System Moderate Resolution Imaging Spectroradiometer (MODIS) instrument aboard the Terra (EOS AM-1) spacecraft. We used the MODIS global monthly Climate Modeling Grid (CMG) products with a spatial resolution of 0.05° x 0.05° (~5.5 x 5.5 km). The data is available here. Reference: Townshend, J. & Justice, Christopher. (2002). Towards operational monitoring of terrestrial systems by moderate-resolution remote sensing. Remote Sensing of Environment. Volume 83, Issues 1-2, Pages: 351-359. 10.1016/S0034-4257(02)00082-2.
This visualization was created on October 2019, to support Dr. Assaf Anyamba’s interview and filming of the upcoming documentary titled Connected produced by Netflix. [Citation: "Clouds". Connected - The Hidden Science of Everything, Season 1, Episode 5, 2 Aug. 2020, Netflix]
Supported with funding from the Defense Health Agency-Armed Forces Health Surveillance Branch (AFHSB) Global Emerging Infections Surveillance and Response System (GEIS) under Project #P0072_19_NS
The rest of this webpage offers frames, layers and colorbar information associated with the development of this data-driven visualization.

This set of frames provides the layer of Normalized Difference Vegetation Index (NDVI) data with Rift Valley Fever outbreak location over land. Frames are provided in 4K resolution with alpha channel for compositing purposes.
This set of frames provides the dates layer for the NDVI Anomaly data with Rift Valley Fever locations of outbreaks for the period of 2007-2011. Frames are provided in 4K resolution with alpha channel.
Colorbar for NDVI Anomaly
- Atmospheric/ocean Indicators
- Climate Indicators
- Climate Variability and Change
- Climatology
- Diseases
- Diseases/Epidemics
- Drought Indices
- Earth Science
- El Nino
- El Nino Southern Oscillation
- Environmental science
- Human Dimensions
- Human geography
- Human Health
- Hyperwall
- La Nina
- NDVI
- Precipitation Indices
- Public Health
- Sea Surface Temperature Anomaly
- Sea Surface Temperature Indices
- Seasons
- SST Anomaly
- Teleconnections
- Vegetation
Credits
Please give credit for this item to:
NASA's Scientific Visualization Studio
-
Visualizers
- Helen-Nicole Kostis (USRA)
- Greg Shirah (NASA/GSFC)
-
Scientists
- Assaf Anyamba (USRA)
- Radina Soebiyanto (USRA)
-
Science support
- Jennifer Small (SSAI)
-
Technical support
- Laurence Schuler (ADNET Systems, Inc.)
- Ian Jones (ADNET Systems, Inc.)
-
Project support
- Leann Johnson (Global Science and Technology, Inc.)
- Eric Sokolowsky (Global Science and Technology, Inc.)
Release date
This page was originally published on Friday, February 21, 2020.
This page was last updated on Wednesday, November 15, 2023 at 12:13 AM EST.
Datasets used in this visualization
-
ProMED Disease Outbreak Data (Disease Outbreak Data from the Program for Monitoring Emerging Diseases (ProMED))
ID: 1075 -
Disease Outbreak Data from the World Organisation for Animal Health/Organisation mondiale de la santé animale (OIE)
ID: 1077 -
NASA/Terra/MODIS/Global Monthly Normalized Difference Vegetation Index (NDVI)
ID: 1079
Note: While we identify the data sets used in these visualizations, we do not store any further details, nor the data sets themselves on our site.
Related
- ID: 4782
- ID: 4783
- ID: 4724
- ID: 4784
- ID: 4785
- ID: 4781

- ID: 4765
- ID: 4693
- ID: 4695
- ID: 4696
- ID: 4697