The Taurus-Littrow Valley through LRO's Eyes
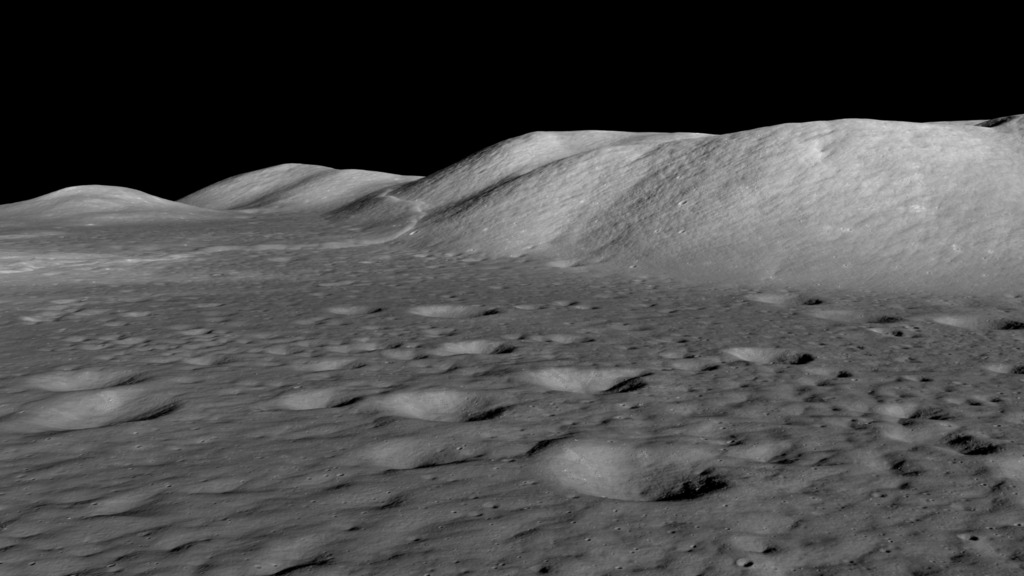
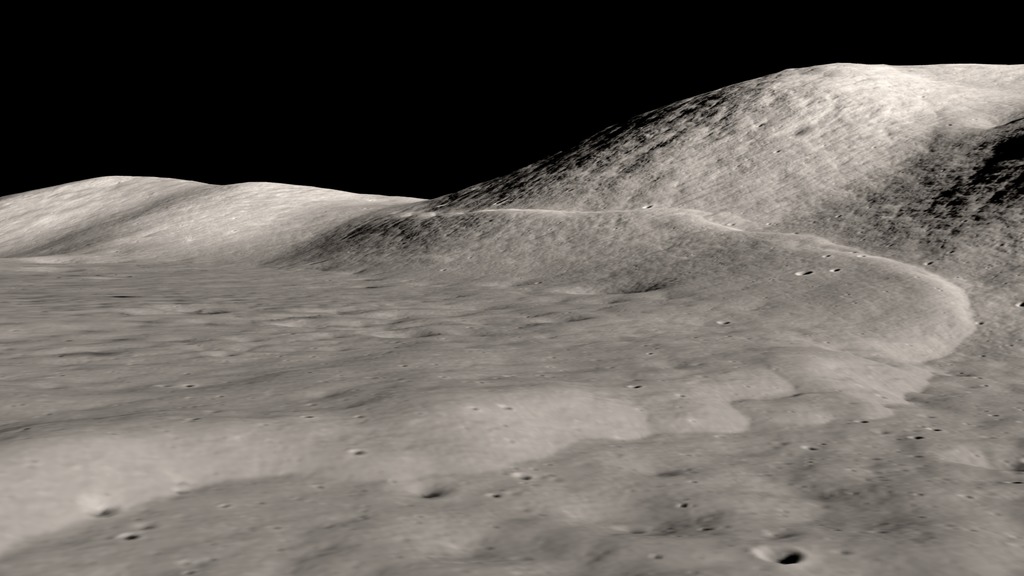
This visualization of the Taurus-Littrow valley, site of the Apollo 17 Moon landing, uses multiple Lunar Reconnaissance Orbiter datasets to zoom into the valley and illustrate the paths taken by the astronauts during their three days of exploration at the site. The data includes wide-angle (WAC) and narrow-angle (NAC) camera images, LOLA laser altimetry, and a high-resolution elevation map created from NAC stereo pairs. The imagery was chosen to approximately match the lighting conditions at the time of the landing. Color-coded trails with numbered stops (called stations
in astronaut lingo) show where Eugene Cernan and Harrison Schmitt drove their lunar rover — orange on day 1, blue on day 2, and green on day 3.
The camera flies into the Taurus-Littrow valley, revealing the path taken by the astronauts in the lunar rover during Apollo 17's three EVAs.
Credits
Please give credit for this item to:
NASA's Scientific Visualization Studio
-
Visualizer
- Ernie Wright (USRA)
-
Technical support
- Laurence Schuler (ADNET Systems, Inc.)
- Ian Jones (ADNET Systems, Inc.)
-
Scientist
- Noah Petro (NASA/GSFC)
Release date
This page was originally published on Friday, March 23, 2018.
This page was last updated on Sunday, February 2, 2025 at 12:11 AM EST.
Missions
This page is related to the following missions:Series
This page can be found in the following series:Datasets used
-
NAC (Narrow Angle Camera) [LRO: LROC]
ID: 652 -
LROC WAC [LRO: Wide Angle Camera]
ID: 927 -
SLDEM2015 (DIgital Elevation Model) [LRO/SELENE: LOLA/TC]
ID: 948A digital elevation model of the Moon derived from the Lunar Orbiter Laser Altimeter and the SELENE Terrain Camera. See the description in Icarus. The data is here.
See all pages that use this dataset
Note: While we identify the data sets used on this page, we do not store any further details, nor the data sets themselves on our site.
Related
- ID: 5053
 Visualization
 - ID: 4714
 Visualization
 - ID: 4302
 Visualization