A newer version of this visualization is available.
PACE - Studying Plankton, Aerosols, Clouds, and the Ocean Ecosystem
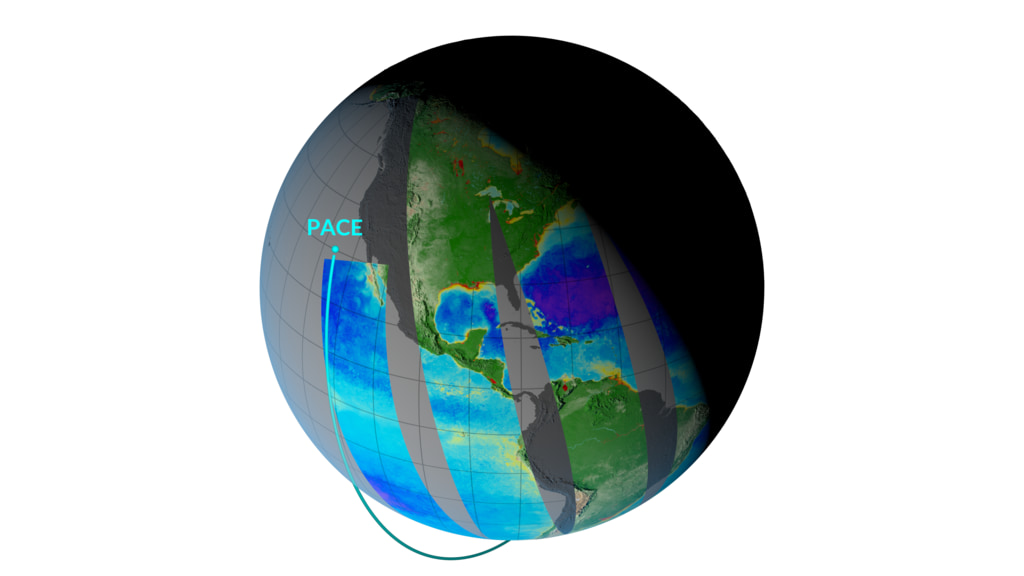
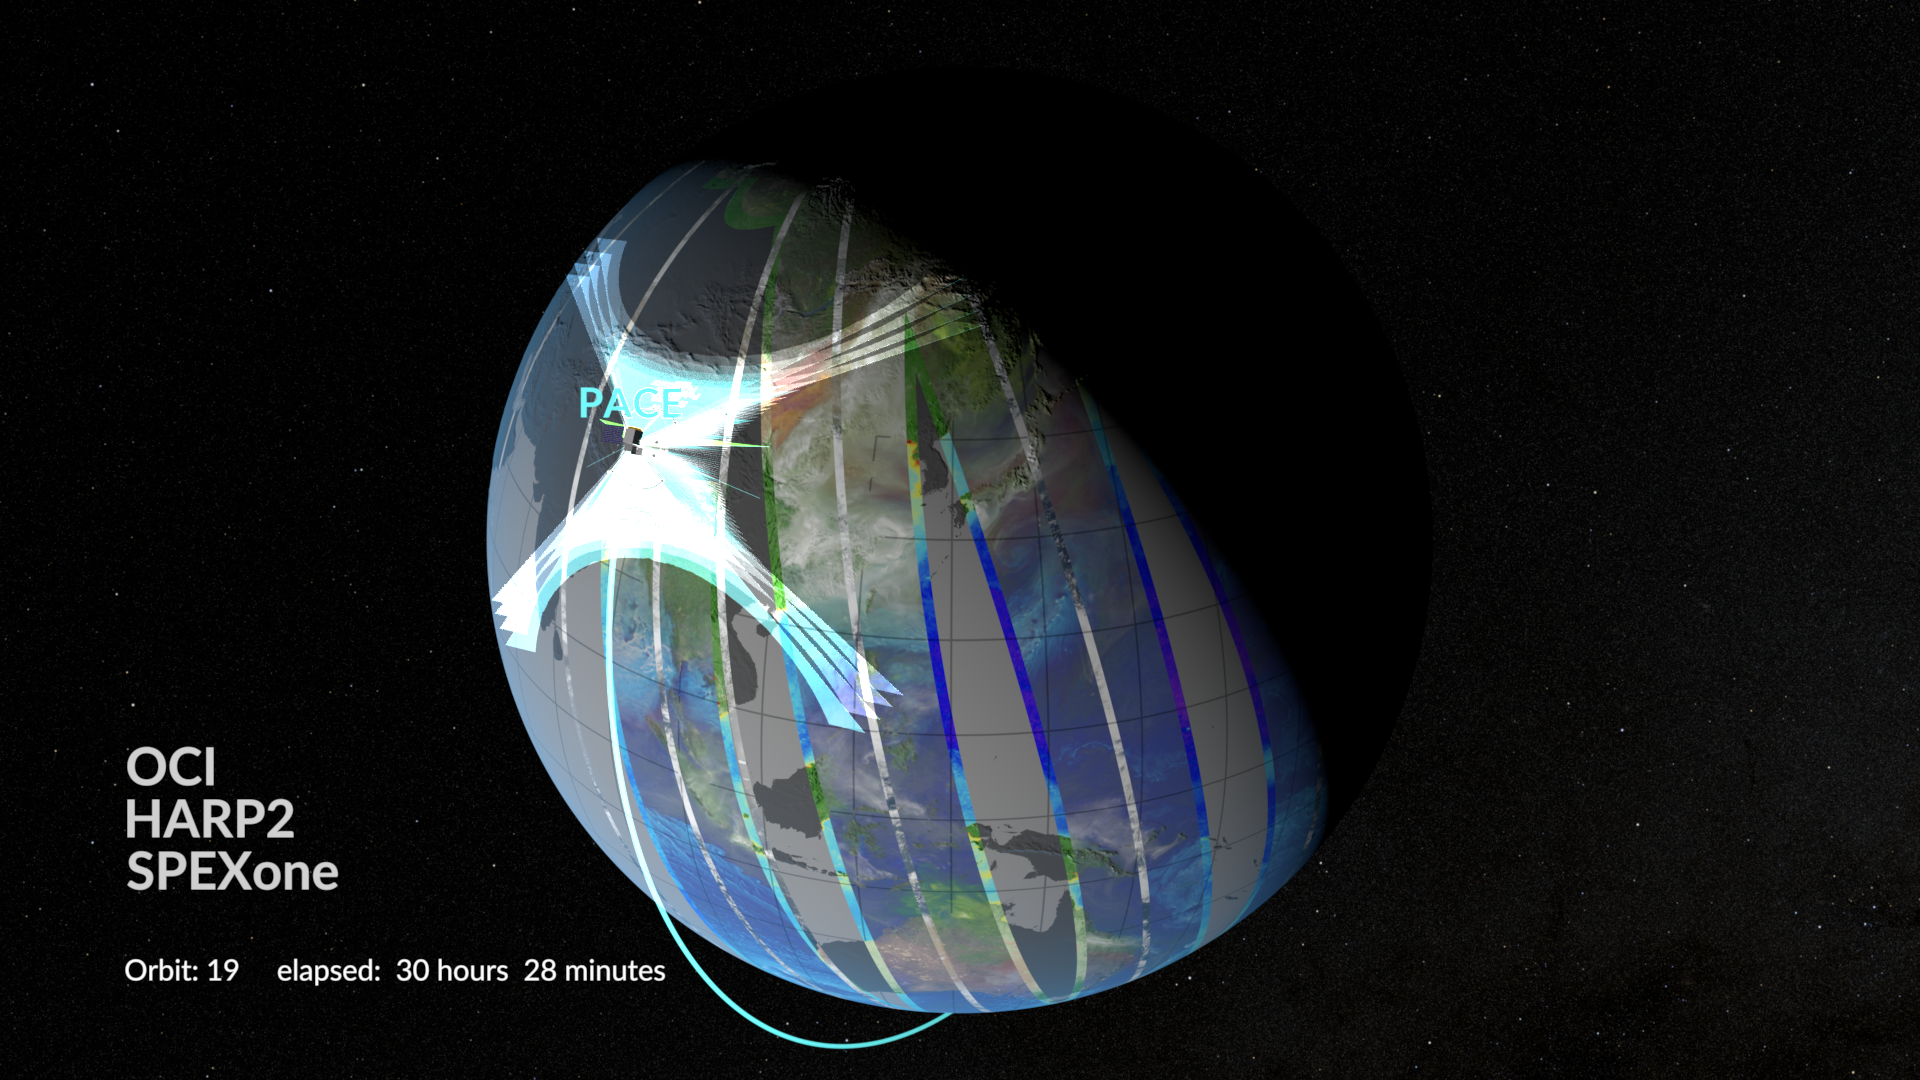
The visualization starts close on the PACE spacecraft. A representative data swath is shown, depicting biosphere plankton data. The camera then pulls out to show the spacecraft's polar orbit. Complete global coverage is achieved after approximately two days of orbits. Over time, the data swath cycles between biosphere, aerosol, and cloud data, representing PACE's collective mission to study Earth's ocean and atmosphere. This version end with animated biosphere data.
In terms of life on Earth, color describes more than simply how features look. In many cases color serves as a proxy for biological processes. When studying ocean biology, colors count in a big way.
NASA’s PACE mission (Plankton, Aerosol, Cloud, ocean Ecosystem) has been conceived principally as a way to measure ocean color for assessing large scale ocean health. These measurements will provide data to determine the distribution of phytoplankton, tiny plants and algae that sustain the marine food web. A simple way to think about this is the more “green” that’s visible from space, the more prevalent are plant cells containing chlorophyll, an essential green pigment responsible for energy-producing photosynthesis in plants. Phytoplankton populations are fundamental to understanding the overall health of the ocean food web, as well as a wide range of related processes.
PACE will be able to see other colors too—a broad range of color, in fact, stretching beyond the bounds of visible light into both ultraviolet as well as infrared. PACE will also be able to make measurements of aerosols in the atmosphere, essential for scientists to improve our understanding of and our ability to forecast weather and climate.
PACE continues a more than 20 year legacy of ocean color measurements, providing the scientific community with a long time series of data. That legacy enables better assessments of long term trends about complex processes on Earth.
The visualization starts close on the PACE spacecraft. A representative data swath is shown, depicting biosphere plankton data. The camera then pulls out to show the spacecraft's polar orbit. Complete global coverage is achieved after approximately two days of orbits. Over time, the data swath cycles between biosphere, aerosol, and cloud data, representing PACE's collective mission to study Earth's ocean and atmosphere. This version end with static biosphere data.
Visualization layer - masked biosphere
Visualization layer - aerosols
Visualization layer - clouds
Visualization layer - animated biosphere
Visualization layer - static biosphere
Visualization layer - PACE spacecraft model
Credits
Please give credit for this item to:
NASA's Scientific Visualization Studio
-
Visualizers
- Kel Elkins (USRA)
- Alex Kekesi (Global Science and Technology, Inc.)
-
Producer
- Michael Starobin (KBR Wyle Services, LLC)
-
Scientist
- Jeremy Werdell (NASA/GSFC)
-
Animators
- Walt Feimer (KBR Wyle Services, LLC)
- Michael Lentz (USRA)
Release date
This page was originally published on Wednesday, December 5, 2018.
This page was last updated on Sunday, January 21, 2024 at 12:10 AM EST.
Datasets used in this visualization
-
Chlorophyll Concentration [SeaStar: SeaWiFS]
ID: 469All SeaWiFS images and data presented on this web site are for research and educational use only. All commercial use of SeaWiFS data must be coordinated with GeoEye.
Credit: NASA/Goddard Space Flight Center, The SeaWiFS Project and GeoEye, Scientific Visualization Studio. NOTE: All SeaWiFS images and data presented on this web site are for research and educational use only. All commercial use of SeaWiFS data must be coordinated with GeoEye (NOTE: In January 2013, DigitalGlobe and GeoEye combined to become one DigitalGlobe.).
This dataset can be found at: http://oceancolor.gsfc.nasa.gov/PRODUCTS/
See all pages that use this dataset -
Comiso's Daily Sea Ice Concentration
ID: 539 -
NDVI [SeaStar: SeaWiFS]
ID: 601All SeaWiFS images and data presented on this web site are for research and educational use only. All commercial use of SeaWiFS data must be coordinated with GeoEye.
Credit: NASA/Goddard Space Flight Center, The SeaWiFS Project and GeoEye, Scientific Visualization Studio. NOTE: All SeaWiFS images and data presented on this web site are for research and educational use only. All commercial use of SeaWiFS data must be coordinated with GeoEye (NOTE: In January 2013, DigitalGlobe and GeoEye combined to become one DigitalGlobe.).
See all pages that use this dataset -
NDVI (Normalized Difference Vegetation Index (NDVI)) [Terra and Aqua: MODIS]
ID: 633 -
GEOS Atmospheric Model
ID: 665 -
VIIRS [Suomi NPP: VIIRS]
ID: 722 -
IMS Daily Northern Hemisphere Snow and Ice Analysis (IMS Daily Northern Hemisphere Snow and Ice Analysis - 24 km Resolution) [Interactive Multisensor Snow and Ice Mapping System (IMS)]
ID: 778This dataset can be found at: http://nsidc.org/data/docs/noaa/g02156_ims_snow_ice_analysis/
See all pages that use this dataset -
chlor_a (Chlorophyll Concentration OCl) [Aqua: MODIS]
ID: 935Credit: Ocean Biology Processing Group (OBPG)
This dataset can be found at: http://oceancolor.gsfc.nasa.gov/cms/atbd/chlor_a
See all pages that use this dataset -
Chlorophyll (Chlorophyll Concentration) [Suomi NPP: VIIRS]
ID: 987 -
Normalized Difference Vegetation Index (NDVI) [Suomi NPP: VIIRS]
ID: 988
Note: While we identify the data sets used in these visualizations, we do not store any further details, nor the data sets themselves on our site.
Related
- ID: 5185
 Visualization
Newer Versions
- ID: 5019
 Visualization
Used as a Source In
- ID: 4742
 Visualization