Land Surface Temperature Anomaly and Dengue Outbreaks in South East Asia Region: 2015-2016
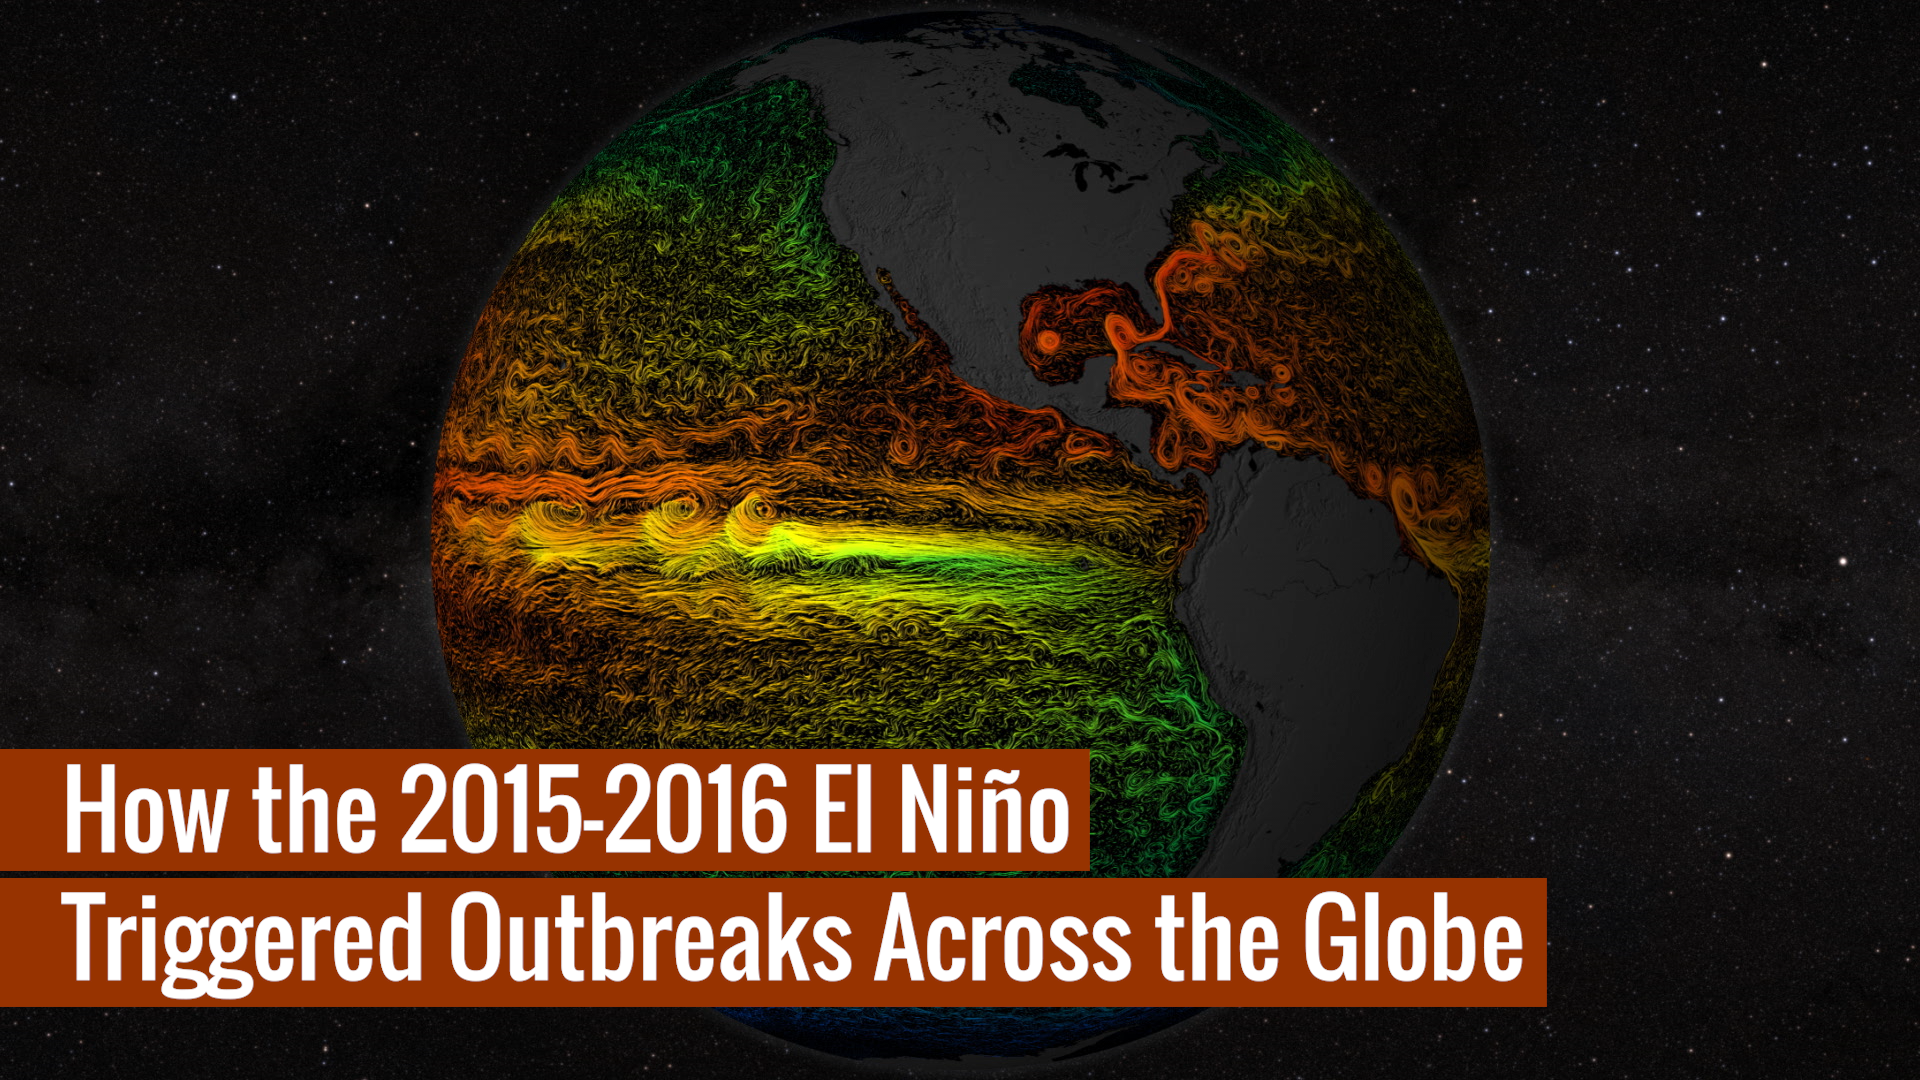
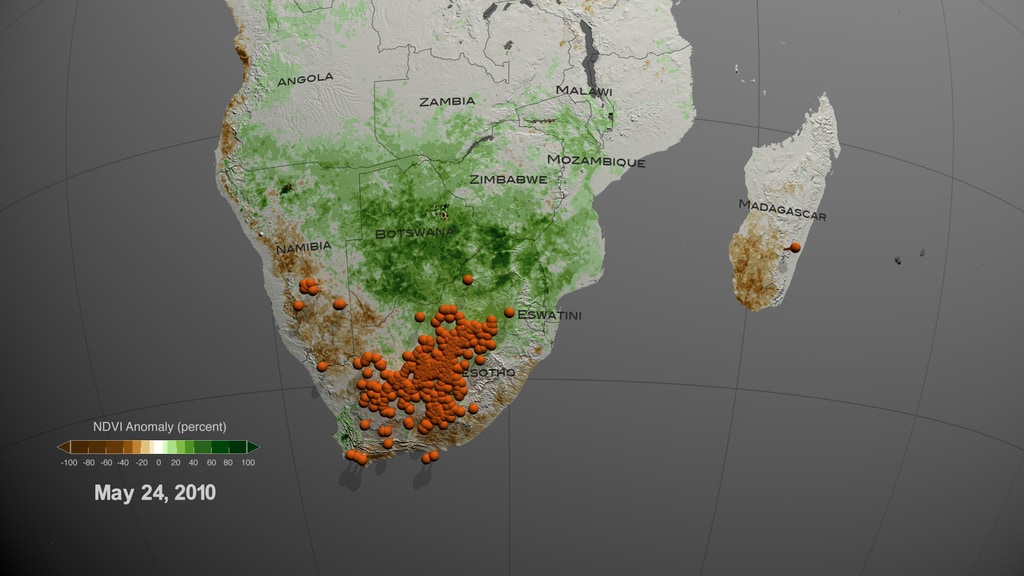
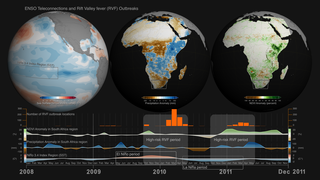
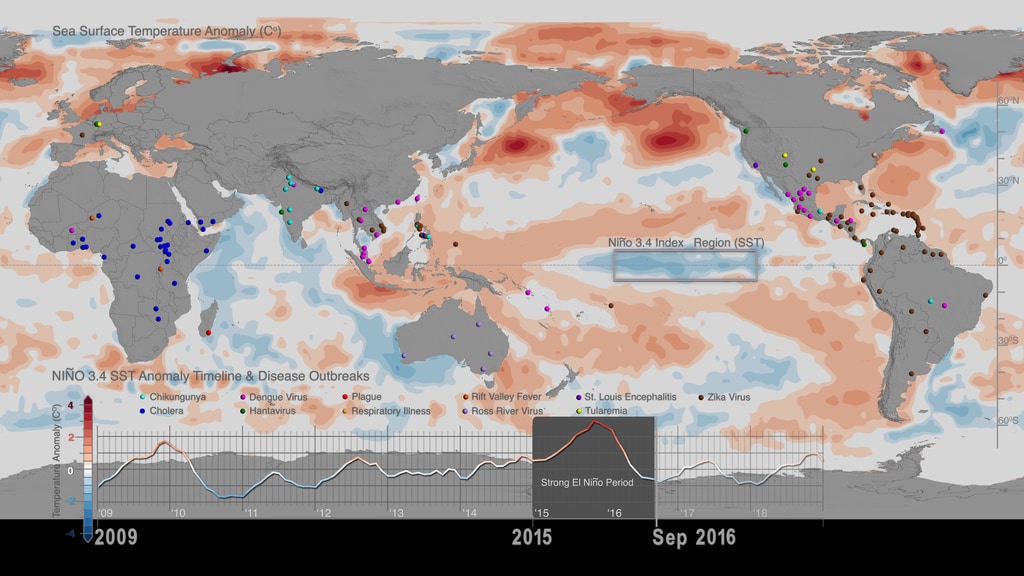
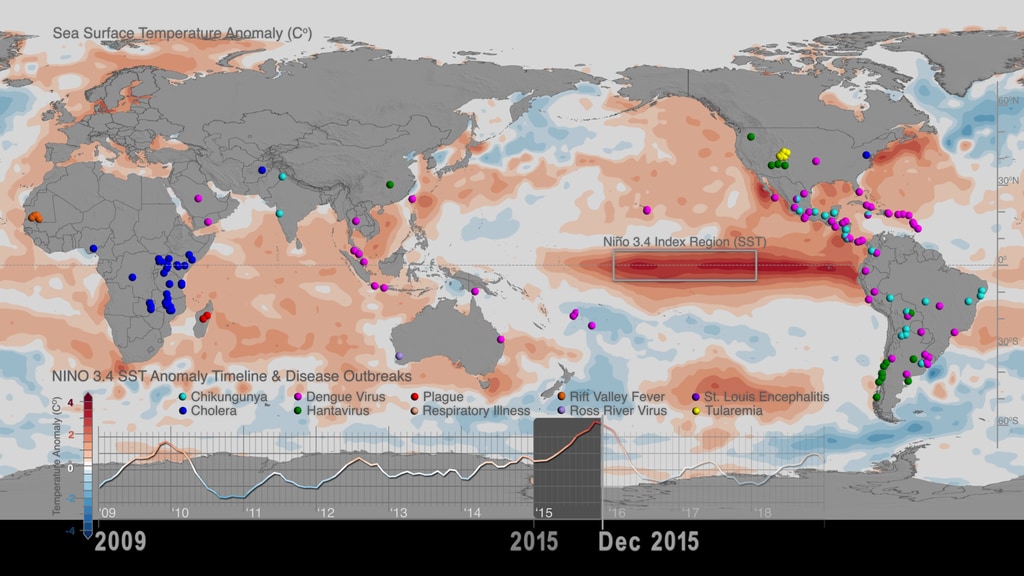
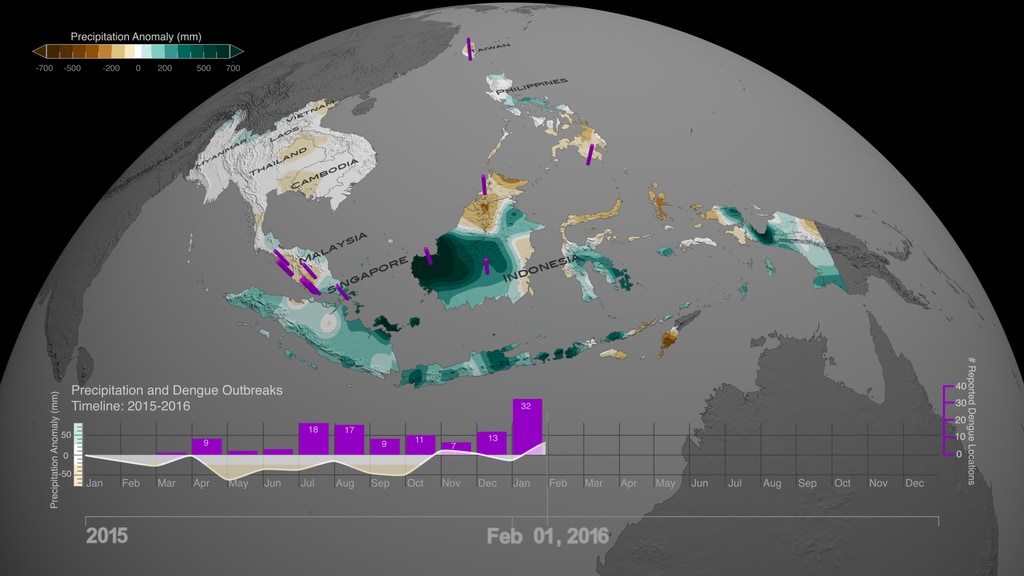
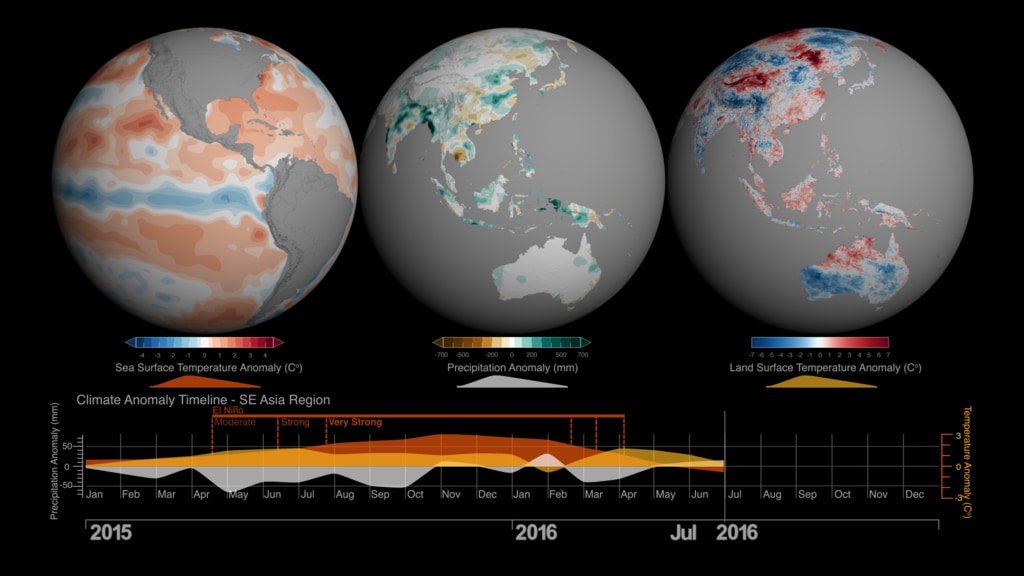
The 2015-2016 El Niño event brought changes to weather conditions across the globe that triggered regional disease outbreaks, including mosquito-borne dengue fever in Southeast Asia. This visualization with corresponding timeplot graph reveals the relationship between land surface temperature anomaly in Southeast Asia and dengue outbreaks. Higher than normal land surface temperatures results in an increase of dengue reported locations.

Land Surface Temperature Anomaly Colorbar
Credits
Please give credit for this item to:
NASA's Scientific Visualization Studio
-
Visualizers
- Helen-Nicole Kostis (USRA)
- Greg Shirah (NASA/GSFC)
-
Scientists
- Assaf Anyamba (USRA)
- Radina Soebiyanto (USRA)
-
Science support
- Jennifer Small (SSAI)
-
Producers
- Matthew R. Radcliff (USRA)
- Helen-Nicole Kostis (USRA)
-
Writer
- Samson K. Reiny (Wyle Information Systems)
-
Technical support
- Laurence Schuler (ADNET Systems, Inc.)
- Ian Jones (ADNET Systems, Inc.)
-
Project support
- Joycelyn Thomson Jones (NASA/GSFC)
- Eric Sokolowsky (Global Science and Technology, Inc.)
- Leann Johnson (Global Science and Technology, Inc.)
Release date
This page was originally published on Thursday, February 28, 2019.
This page was last updated on Wednesday, November 15, 2023 at 12:12 AM EST.
Papers used in this visualization
Assaf Anyamba, Jean-Paul Chretien, Seth C. Britch, Radina P. Soebiyanto, Jennifer L. Small, Rikke Jepsen, Brett M. Forshey, Jose L. Sanchez, Ryan D. Smith, Ryan Harris, Compton J. Tucker, William B. Karesh & Kenneth J. Linthicum, "Global Disease Outbreaks Associated with the 2015–2016 El Niño Event", Scientific Reports, Volume 9, Article number: 1930 (2019). The paper is freely available online at: www.nature.com/articles/s41598-018-38034-z
Datasets used in this visualization
-
CPC UNI (CPC UNI (Climate Prediction Center (CPC) Global Unified) Precipitation) [N/A: Gauge-based]
ID: 1026Climate Prediction Center (CPC) Global Unified Precipitation
See all pages that use this dataset -
Sea Surface Temperature Anomaly (SST) (Oceanic Nino Index (3 month running means of Extended Reconstructed Sea Surface Temperature (ERSST) v5 anomalies) [Multiple: Multisensors including buoys, passive microwave sensors]
ID: 1027Oceanic Nino Index (3 month running means of Extended Reconstructed Sea Surface Temperature (ERSST) v5 anomalies
See all pages that use this dataset -
Land Surface Tempearature Anomaly (MOD11C3 V006: MODIS/Terra Land Surface Temperature and Emissivity Monthly L3 Global 0.05Deg CMG V006) [Terra: Moderate Resolution Imaging Spectroradiometer (MODIS)]
ID: 1028Land Surface Temperature Anomaly MOD11C3 V006: MODIS/Terra Land Surface Temperature and Emissivity Monthly L3 Global 0.05Deg CMG V006
See all pages that use this dataset -
Disease Reports
ID: 1029Disease reports were obtained from ProMED Mail (Program for Monitoring Emerging Diseases), an online informal disease outbreak reporting systems. Disease incidents and/or outbreaks are reported by contributors/subscribers worldwide and subsequently screened, reviewed and validated by expert moderators. ProMED also includes reports from media, government and health agencies internationally.
This dataset can be found at: https://promedmail.org/aboutus/
See all pages that use this dataset
Note: While we identify the data sets used in these visualizations, we do not store any further details, nor the data sets themselves on our site.
Related
- ID: 4782
- ID: 4783
- ID: 4724
- ID: 4747
- ID: 4784
- ID: 4785
- ID: 4781

- ID: 4765
- ID: 4693
- ID: 4695
- ID: 4697
Used as a Source In
- ID: 13152