NASA Scientists see Gravity Waves in Concentric Rings
NASA scientists have tracked gravity waves traveling thousands of miles across our atmosphere in concentric rings. Large storms can create these waves, which grow and spread upward hundreds of miles above Earth's surface.
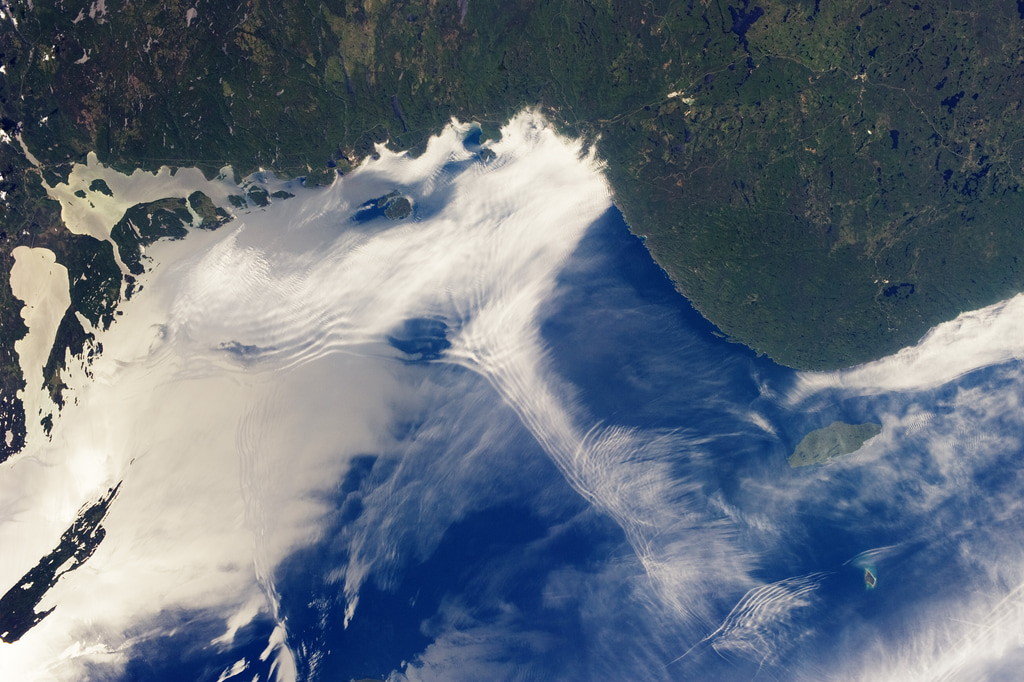
The AIRS instrument on NASA's Aqua satellite detected gravity waves in the troposphere and stratosphere 12 hours before a deadly EF5 tornado in Moore, Oklahoma, in 2013. On the instrument's next pass 11 hours later, it detected even stronger waves.
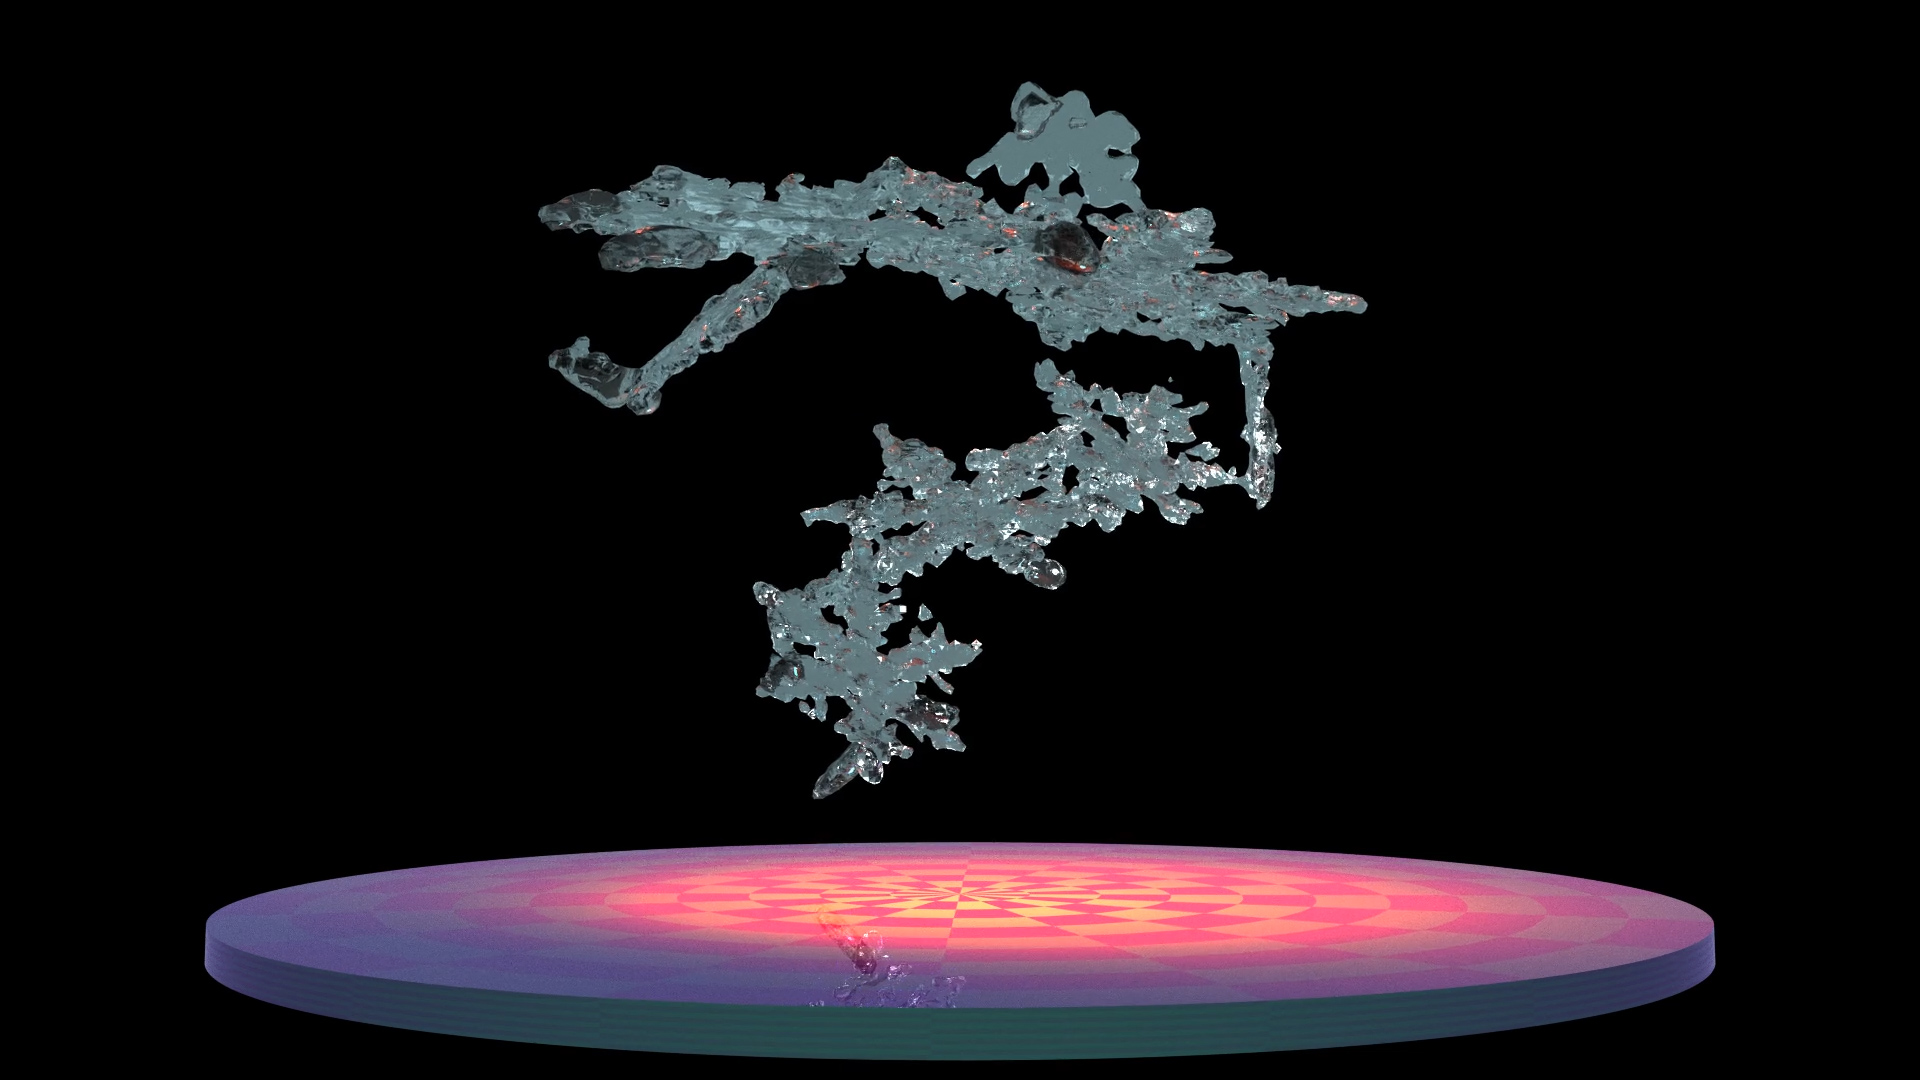
We pull up 250 miles to the ionosphere, where the waves can be observed by GPS satellites. Here gravity waves are shown in greens and yellows, like ripples in a pond.
The waves and tornado were both produced by a long-lived storm system.
Understanding the spread of gravity waves improves global weather forecasting and space weather forecasting.
Complete transcript available.
This video is also available on our YouTube channel.
NASA scientists have tracked gravity waves spreading upward for hundreds of miles and outward for thousands of miles in concentric rings, like ripples in a pond. The waves were created by a large convective storm in 2013 that also spawned a deadly tornado. The visualization shows near-simultaneous measurements of the gravity waves in the troposphere, stratosphere and ionosphere.
The Atmospheric Infrared Sounder (AIRS) instrument on NASA's Aqua satellite detected gravity waves in the troposphere and stratosphere 12 hours before a deadly EF5 tornado in Moore, Oklahoma. Even stronger waves were detected 11 hours later during AIRS’ next pass. The tornado and waves were produced by a long-lived storm system.
In the ionosphere 250 miles (400 kilometers) above Earth's surface, the gravity waves appear as traveling ionospheric disturbances (TIDs) -- disturbances in the electron content of the region. These were observed in Total Electron Content measurements by ground-based GPS receivers throughout the south central United States. In the visualization, these ionospheric disturbances are shown in greens and yellows.
Gravity waves are formed when a disturbance causes air to be displaced into a region of different air density. There are many common causes for this besides storms -- for example, an air current strikes a mountain and is pushed upward. As gravity waves grow and propagate upward, they play important roles in the upper levels of the atmosphere. In the stratosphere, gravity waves help drive the atmospheric circulation and move ozone from the tropics to the poles.
Observations such as these at multiple heights in the atmosphere provide a unique perspective on how atmospheric layers are linked together. Understanding the spread of gravity waves improves global weather forecasting and space weather forecasting.

We pull up 250 miles to the ionosphere, where the waves can be observed by GPS satellites. Here gravity waves are shown in greens and yellows, like ripples in a pond.
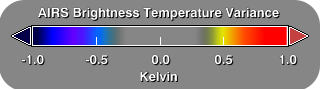
AIRS brightness temperature variance colorbar
Total Electron Content colorbar for data collected in the Ionosphere from GPS satellites.
Credits
Please give credit for this item to:
NASA's Scientific Visualization Studio
-
Data visualizer
- Lori Perkins (NASA/GSFC)
-
Scientists
- Eric Fetzer (NASA/JPL CalTech)
- Jie Gong (USRA)
- Jia Yue (University of Maryland)
- S. Irfan Azeem (National Science Foundation (NSF))
- Dong Wu (NASA/GSFC)
-
Project support
- Sharon Ray (NASA/JPL CalTech)
- Tom Pagano (NASA/JPL CalTech)
-
Writer
- Carol Rasmussen (NASA/JPL CalTech)
Release date
This page was originally published on Wednesday, October 10, 2018.
This page was last updated on Thursday, February 22, 2024 at 12:10 AM EST.
Series
This visualization can be found in the following series:Papers used in this visualization
Journal of Geophysical Research: Atmospheres "Global survey of concentric gravity waves in AIRS images and ECMWF analysis" http://onlinelibrary.wiley.com/doi/10.1002/2014JD022527 "Multisensor profiling of a concentric gravity wave event propagating from the troposphere to the ionosphere". http://onlinelibrary.wiley.com/doi/10.1002/2015GL065903/abstract
Datasets used in this visualization
-
Total Electron Content (TEC) [NAVSTAR: World-wide GPS Receiver Network]
ID: 580This dataset can be found at: http://www.navcen.uscg.gov/GPS/geninfo/
See all pages that use this dataset -
CPC (Climate Prediction Center) Cloud Composite
ID: 600Global cloud cover from multiple satellites
See all pages that use this dataset -
Tb (Brigtness Temperature Variance) [Aqua: AIRS]
ID: 1016
Note: While we identify the data sets used in these visualizations, we do not store any further details, nor the data sets themselves on our site.
Related
- ID: 14445
 Produced Video
Used as a Source In
- ID: 4742
 Visualization