MMS Sees a New Type of Reconnection
The Magnetospheric Multiscale (MMS) mission consists of four identical satellites that traverse various regions of Earth's magnetosphere measuring the particles and electric and magnetic field which influence them.
In the turbulent plasma between Earth's magnetopause and bow shock, a region called the magnetosheath, the MMS satellite constellation has measured multiple jets of energetic electrons between magnetic bubbles. This appears to be a new 'flavor' of magnetic reconnection based on electrons and occuring on smaller time and spatial scales than the standard model of magnetic reconnection with ions.
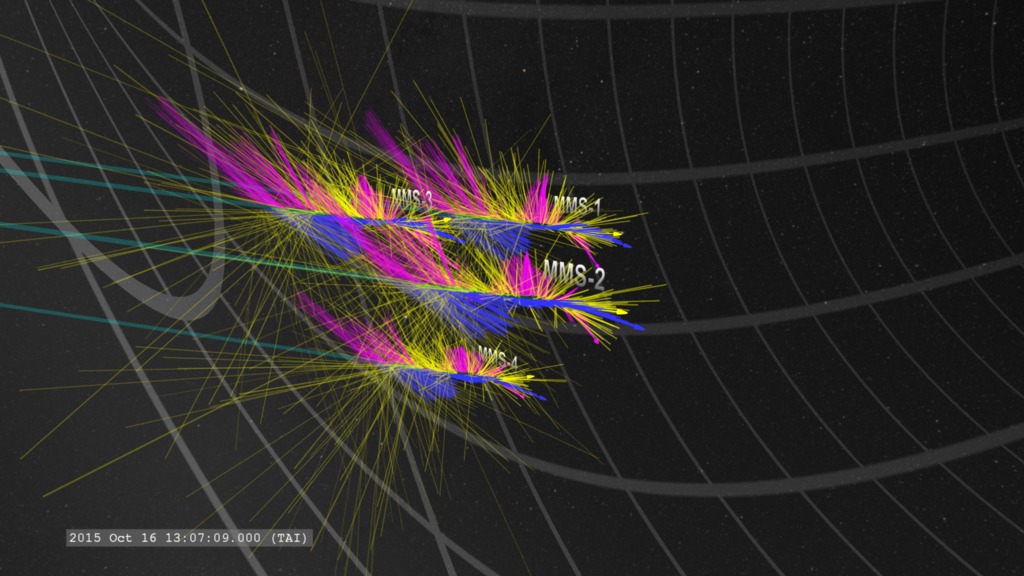
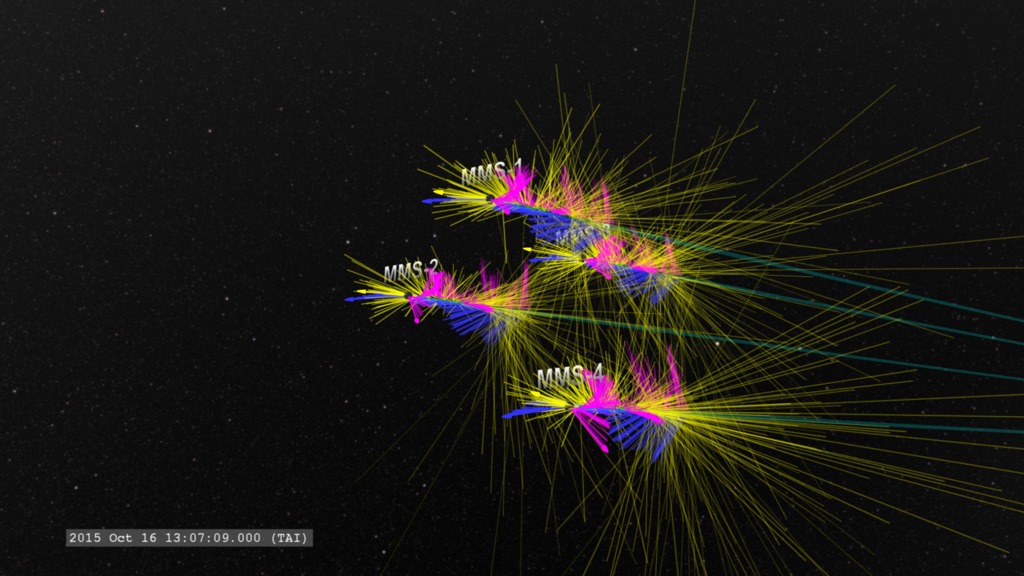
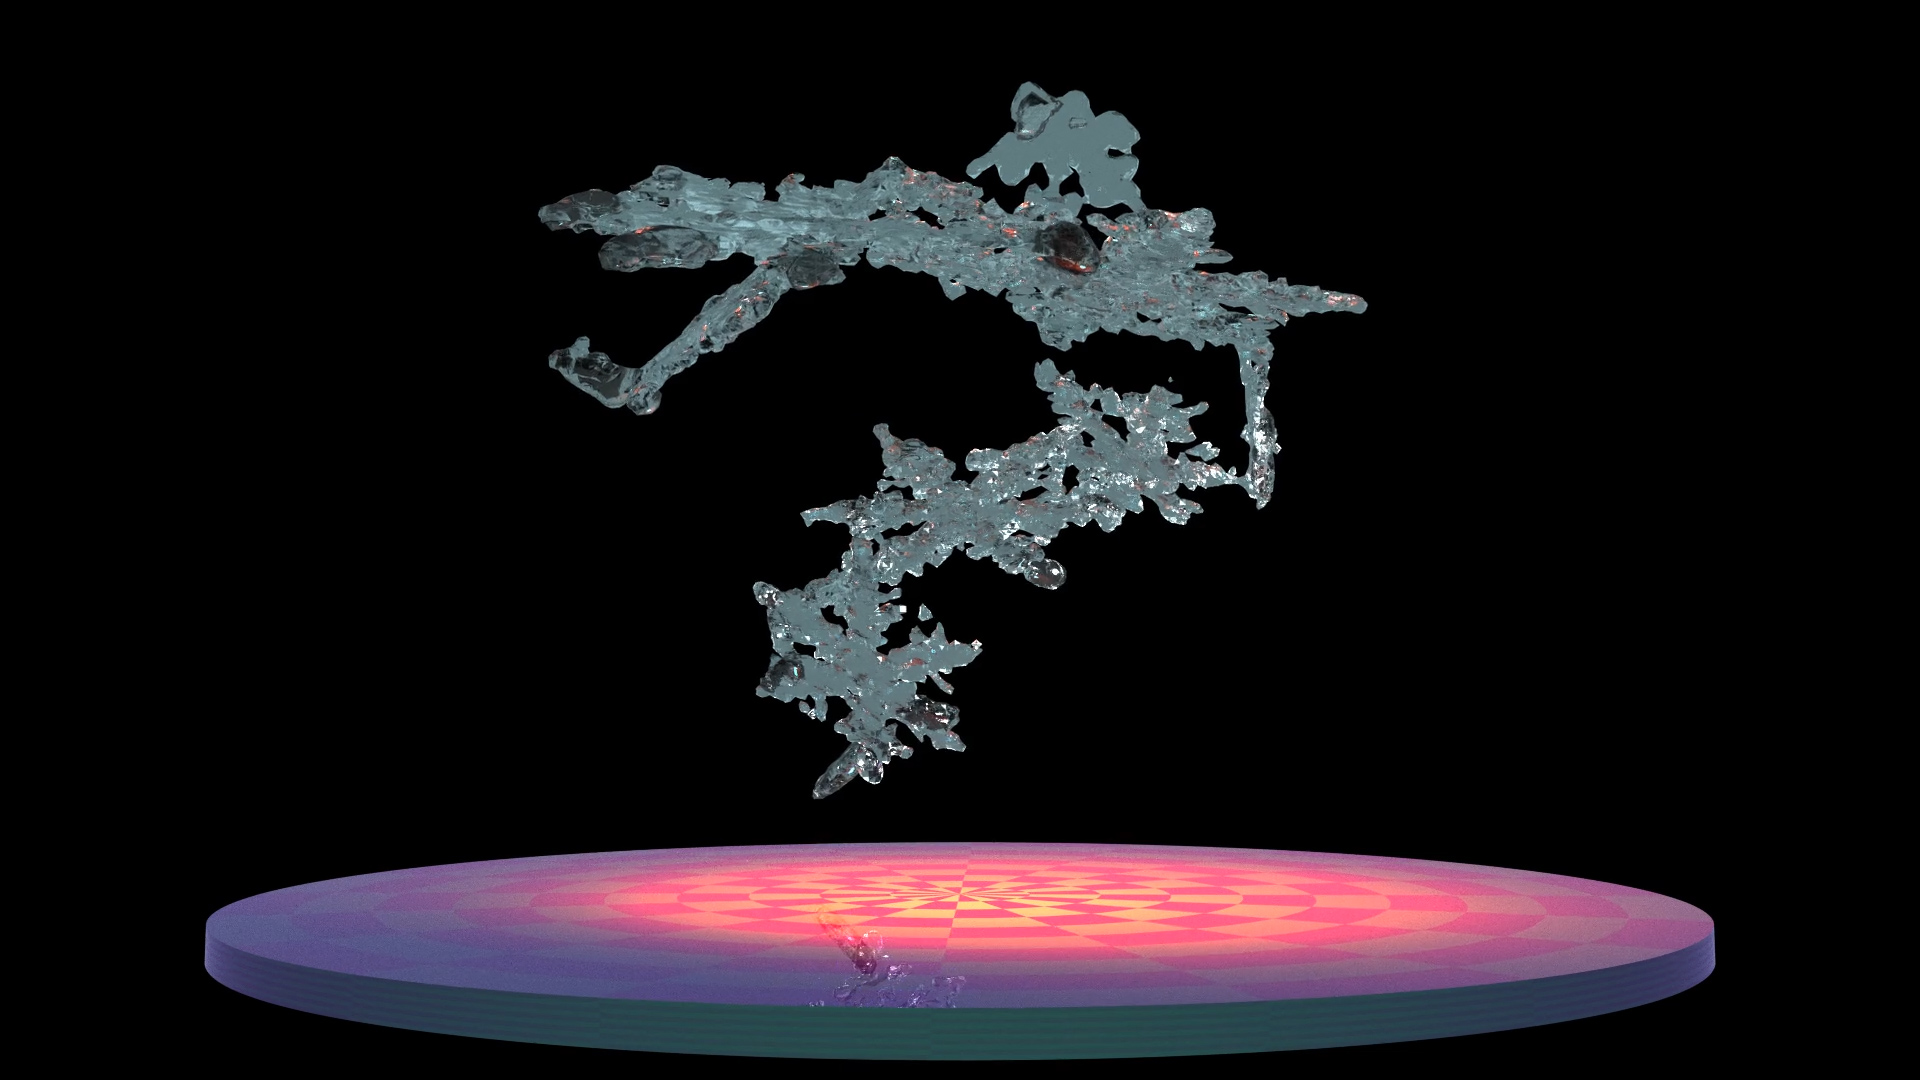
In these data visualizations, the arrows represent the data collected by the spacecraft. To better comprehend changes as the spacecraft moves along, the data are allowed to 'echo' along the spacecraft trail. The length of the vectors represent the relative magnitude of the vector. However, the electron and proton vectors are scaled so equal velocities correspond to vectors of equal magnitude.
Magenta represents the direction and magnitude of the magnetic field at the spacecraft position. Green represents the direction and magnitude of the net electric current created by the motion of the electrons and ions measured at the spacecraft position.
The four MMS spacecraft are represented by colored spheres, corresponding to the plotted data lines in the lower graphic
MMS1 MMS2 MMS3 MMS4
The clocks on MMS are synchronized for the TAI (International Atomic Time) system provided through the Global Positioning System (GPS) satellites. It provides a high-precision time reference for comparing MMS measurements to other datasets.
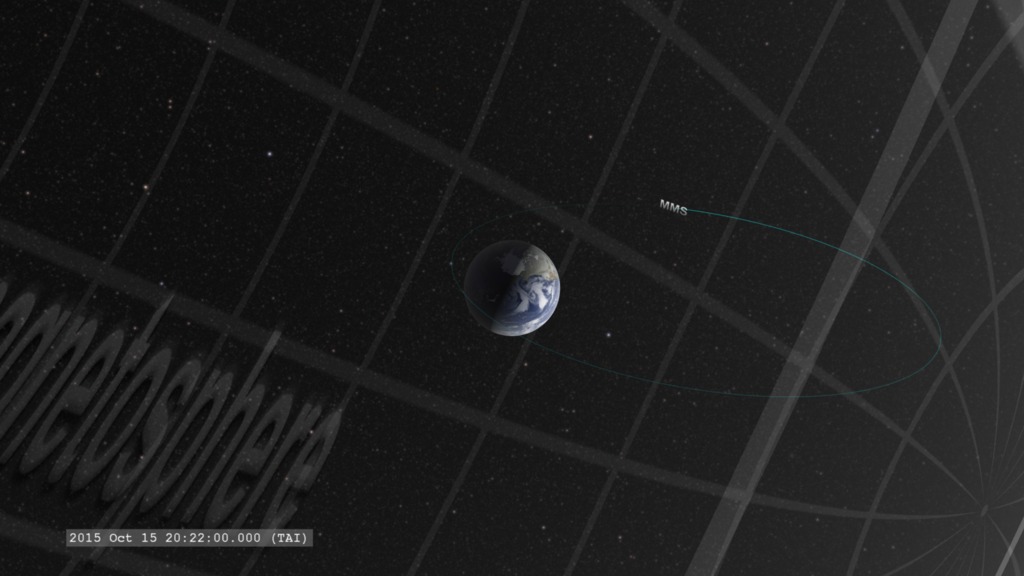
From a wide view of the MMS orbit, this visualization zooms down to the four spacecraft as they move between the magnetopause and bow shock. Along the track of each spacecraft we see the measured magnetic field vectors (magenta arrows) and the measured current vectors (green arrows). The energetic event of interest occurs at clock time of 09:03:54.3 TAI.
This visualization travels along with the four MMS spacecraft as they move between the magnetopause and bow shock. Along the track of each spacecraft we see the measured magnetic field vectors (magenta arrows) and the measured current vectors (green arrows). This view illustrates the dramatic changes in the magnetic field measurements as the spacecraft travel between the plasma 'bubbles' in this region. The energetic event of interest occurs at clock time of 09:03:54.3 TAI. This version has a lower time resolution (0.15 seconds per frame) so some detail is lost. This visualization is frame-synchronized with the animated graph.
From a wide view of the MMS orbit, this visualization zooms down to the four spacecraft as they move between the magnetopause and bow shock. Along the track of each spacecraft we see the measured magnetic field vectors (magenta arrows) and the measured current vectors (green arrows). The energetic event of interest occurs at clock time of 09:03:54.3 TAI.
From a wide view of the MMS orbit, this visualization zooms down to the four spacecraft as they move between the magnetopause and bow shock. Along the track of each spacecraft we see the measured magnetic field vectors (magenta arrows) and the measured current vectors (green arrows). The energetic event of interest occurs at clock time of 09:03:54.3 TAI.
Animated plot of current measured by the MMS spacecraft. This animation is frame-synchronized with the DataTour visualization above. It also plots the data at a higher time-resolution than DataTour. Colors correspond to the spacecraft doing the measurement. Red=MMS1, blue=MMS2, cyan=MMS3, yellow=MMS4.
Credits
Please give credit for this item to:
NASA's Scientific Visualization Studio
-
Visualizer
- Tom Bridgman (Global Science and Technology, Inc.)
-
Scientist
- Tai Phan (University of California at Berkeley)
-
Producer
- Joy Ng (USRA)
-
Writer
- Mara Johnson-Groh (Wyle Information Systems)
Release date
This page was originally published on Wednesday, May 9, 2018.
This page was last updated on Wednesday, November 15, 2023 at 12:11 AM EST.
Missions
This visualization is related to the following missions:Datasets used in this visualization
-
MMS-FIELDS [MMS: FIELDS]
ID: 920 -
MMS-FPI [MMS: Fast Plasma Investigation]
ID: 921
Note: While we identify the data sets used in these visualizations, we do not store any further details, nor the data sets themselves on our site.
Related
- ID: 4453
 Visualization
 - ID: 4454
 Visualization
 - ID: 4460
 Visualization
Used as a Source In
- ID: 4742
 Visualization
 - ID: 12901