GRACE 15-Year Groundwater Trends
Africa, No Colorbar
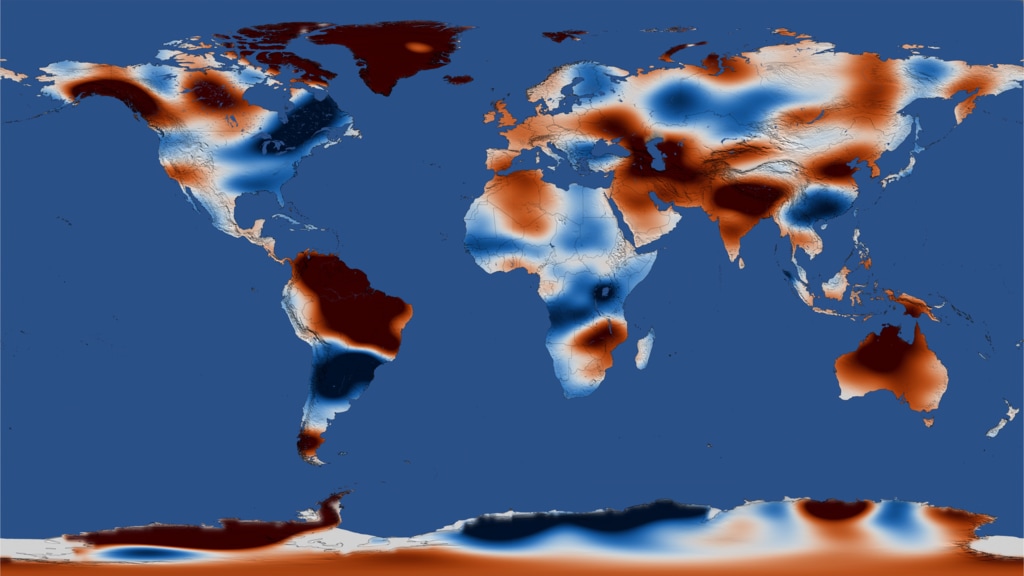
NASA scientists used GRACE data to identify regional trends of freshwater movement, and combined that information with data from other satellites, climate models and precipitation measurements to determine the causes of major regional trends in freshwater storage. In these visualizations, the colors represent liquid water equivalent thinckness, while the animated graph overlay represents the terrestrial water storage anomaly.
Africa, With Colorbar
Africa, No Graph, No Colorbar
Africa, No Graph, With Colorbar
China, No Colorbar
China, With Colorbar
China, No Graph, No Colorbar
China, No Graph, With Colorbar
Saudi Arabia, No Colorbar
Saudi Arabia, With Colorbar
Saudi Arabia, No Graph, No Colorbar
Saudi Arabia, No Graph, With Colorbar
Whole Earth, Robinson Projection

Whole Earth, Plate Carree Projection
Dates
Colorbar
Credits
Please give credit for this item to:
NASA's Scientific Visualization Studio
-
Visualizer
- Trent L. Schindler (USRA)
-
Producer
- Kathryn Mersmann (USRA)
-
Writer
- Ellen T. Gray (ADNET Systems, Inc.)
-
Scientist
- Matthew Rodell (NASA/GSFC)
Release date
This page was originally published on Wednesday, May 16, 2018.
This page was last updated on Wednesday, November 15, 2023 at 12:11 AM EST.
Datasets used in this visualization
-
[Gravity Recovery and Climate Experiment (GRACE)]
ID: 221 -
BMNG (Blue Marble: Next Generation) [Terra and Aqua: MODIS]
ID: 508Credit: The Blue Marble data is courtesy of Reto Stockli (NASA/GSFC).
This dataset can be found at: http://earthobservatory.nasa.gov/Newsroom/BlueMarble/
See all pages that use this dataset
Note: While we identify the data sets used in these visualizations, we do not store any further details, nor the data sets themselves on our site.
Used as a Source In
- ID: 12950
 Produced Video
 - ID: 12876
![Increased irrigation in Saudi Arabia led to depleted groundwater in the desert. Music: Iron Throne by Anthony Giordano [SACEM]Complete transcript available.](/vis/a010000/a012800/a012876/Screen_Shot_2018-05-11_at_5.24.13_PM.png)