Magnetic Bubbles on the Moon...
View of 'deluxe' model with camera in fixed position. Fades from schematic view showing underground dipole field sources (blue and yellow arrows), induced electric field (red arrows) and magnetic field (gold curves) to a view with Reiner Gamma region of moon. Solar protons (blue) rain down on lunar surface with enhanced accumulation near dipoles.
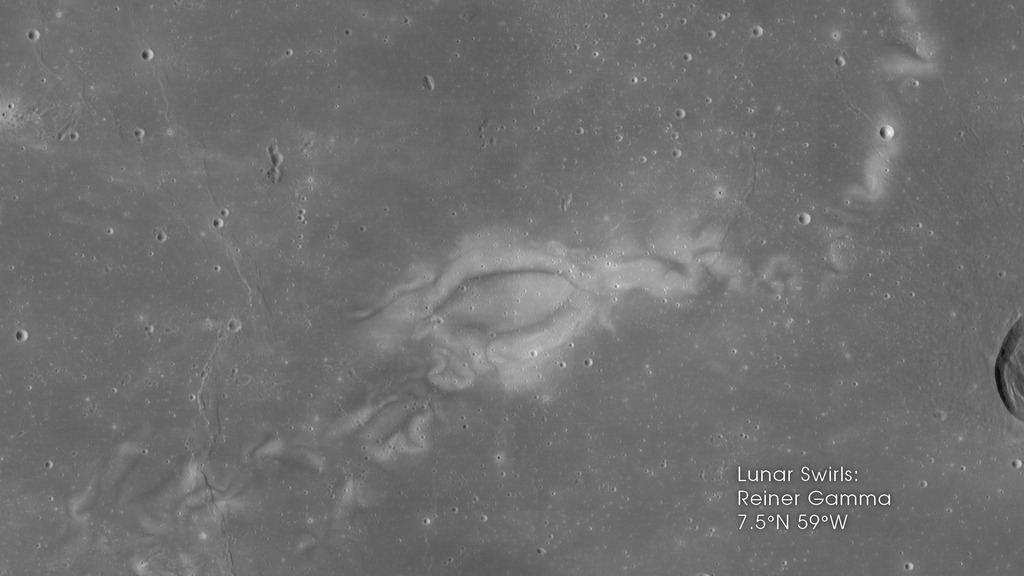
Much of the Moon's darker-colored 'mare' regions are considered to be older than the lighter-colored mountainous regions. Yet the maria contain a number of ligher-colored regions, such as Reiner Gamma. Why could that be? Many of these lighter regions in the maria appear to correspond to locations of magnetic anomalies which provides a hint for testing various hypotheses.
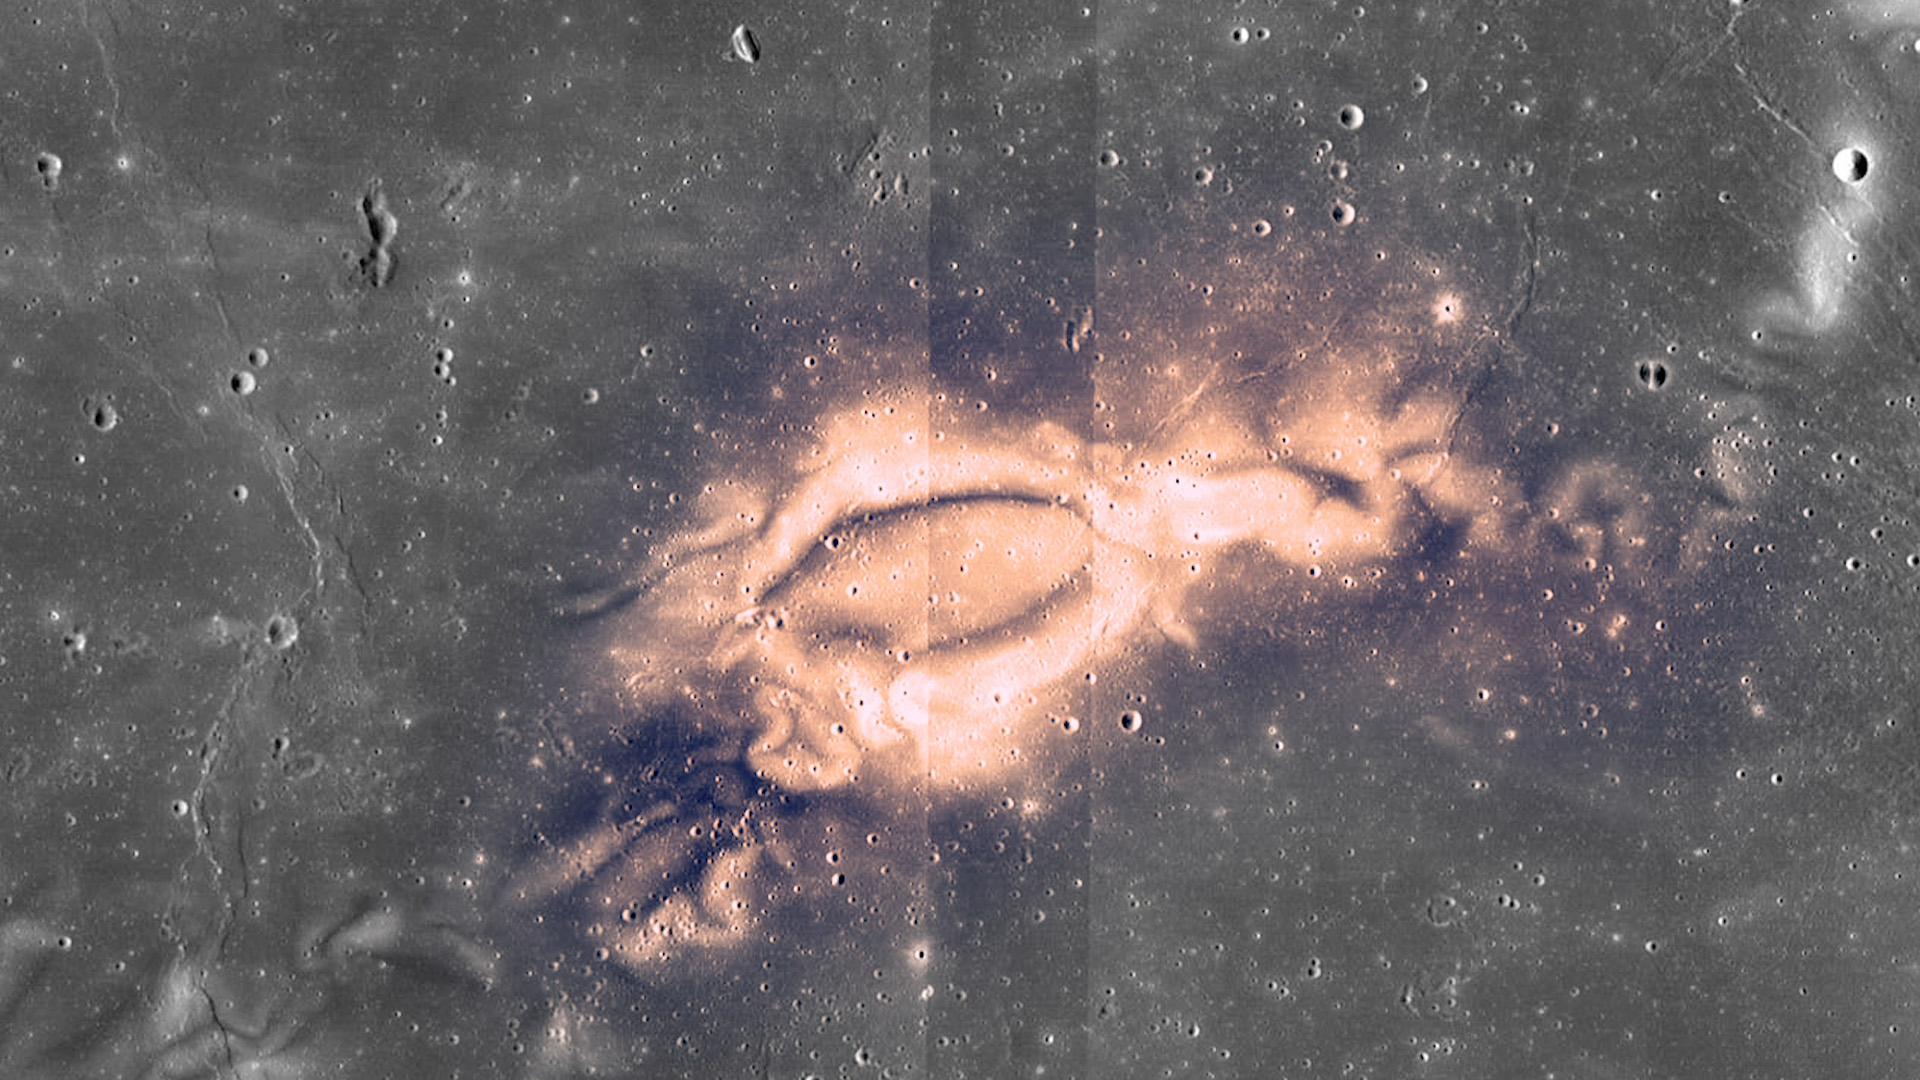
It is known that the influx of free protons from the solar wind will darken the lighter lunar material. This visualization is created from a particle simulation which illustrates how a local magnetic field may create regions of reduced and enhanced solar proton flux which can lighten and darken (respectively) the underlying lunar material.
View of 'deluxe' model with camera in slow move. Fades from schematic view showing underground dipole field sources (blue and yellow arrows), induced electric field (red arrows) and magnetic field (gold curves) to a view with Reiner Gamma region of moon. Solar protons (blue) rain down on lunar surface with enhanced accumulation near dipoles.
View of basic model with camera in fixed position. Shows induced electric field (red arrows) and magnetic field (gold curves) co-registered with LRO image of Reiner Gamma region of moon. Solar protons (blue) rain down on lunar surface with enhanced accumulation near dipoles.
View of basic model with camera making slow move. Shows induced electric field (red arrows) and magnetic field (gold curves) co-registered with LRO image of Reiner Gamma region of moon. Solar protons (blue) rain down on lunar surface with enhanced accumulation near dipoles.
Basic 2-D animated plot of data from this simulation showing magnetic field (blue curves), lunar surface (grey band at bottom), buried dipoles (blue dots on ground), solar wind protons raining down (orange tracks) with some reflected (changing to yellow). A thin band at the lunar surface darkens as particle impacts accumulate.
Credits
Please give credit for this item to:
NASA's Scientific Visualization Studio
-
Visualizers
- Tom Bridgman (Global Science and Technology, Inc.)
- Ernie Wright (USRA)
-
Scientist
- Andrew Poppe (University of California at Berkeley)
-
Producer
- Genna Duberstein (USRA)
-
Technical support
- Ian Jones (ADNET Systems, Inc.)
- Laurence Schuler (ADNET Systems, Inc.)
Release date
This page was originally published on Wednesday, February 27, 2019.
This page was last updated on Wednesday, November 15, 2023 at 12:11 AM EST.
Missions
This visualization is related to the following missions:Papers used in this visualization
Datasets used in this visualization
-
Holmstrom Plasma Solver
ID: 1035
Note: While we identify the data sets used in these visualizations, we do not store any further details, nor the data sets themselves on our site.
Related
- ID: 4468
 Visualization
Used as a Source In
- ID: 13150
 Produced Video