Disappearing Ice
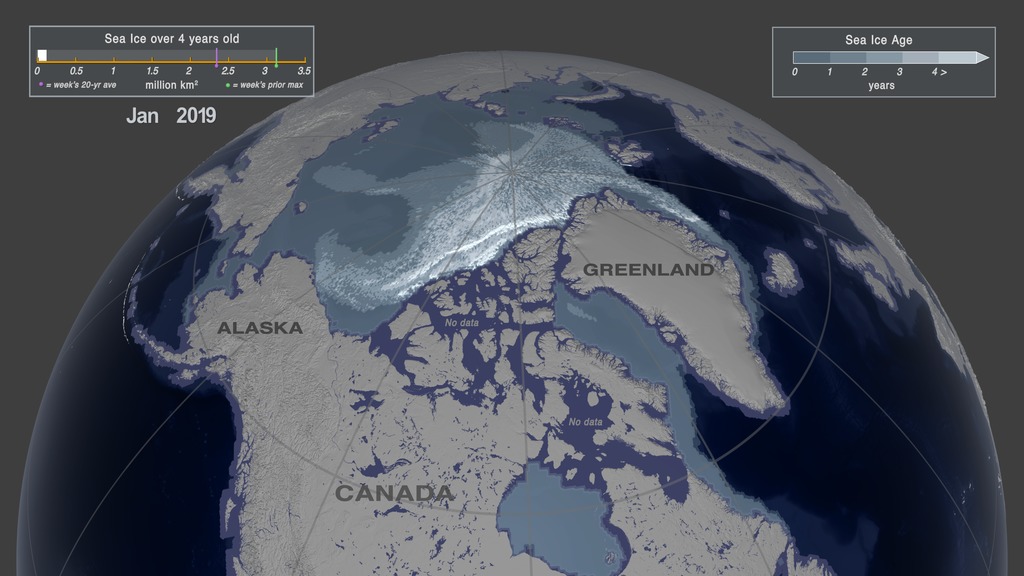
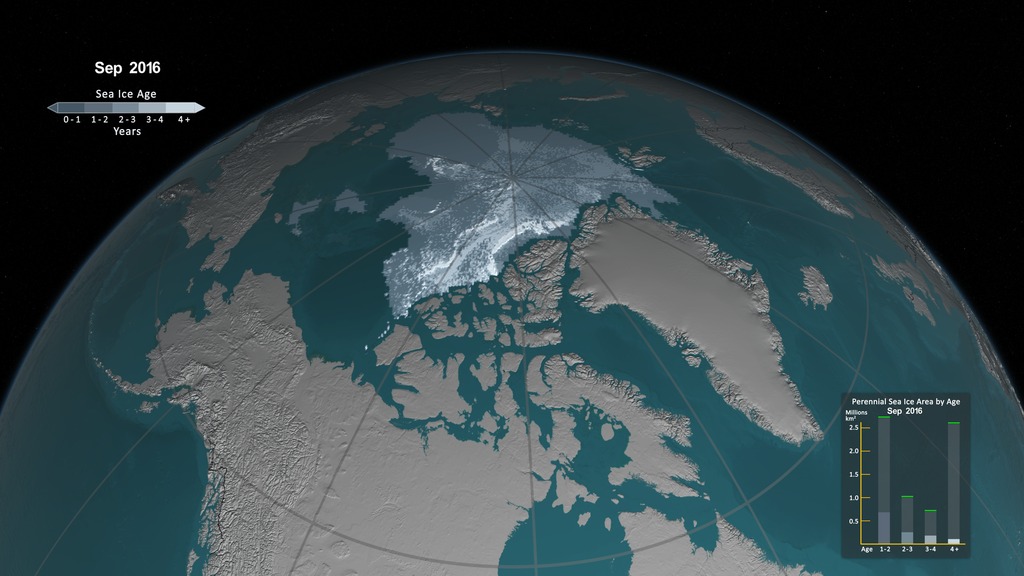
This visualization begins by showing the dynamic beauty of the Arctic sea ice as it responds to winds and ocean currents. Research into the behavior of the Arctic sea ice for the last 30 years has led to a deeper understanding of how this ice survives from year to year. In the animation that follows, age of the sea ice is visible, showing the younger ice in darker shades of blue and the oldest ice in brighter white. This visual representation of the ice age clearly shows how the quantity of older and thicker ice has changed between 1984 and 2016.
Complete transcript available.
Data may encapsulate the events of a single second or many years; it may span a small patch of Earth or entire systems of suns and planets. Visualizing data within its natural environment maximizes the potential for learning and discovery. Scientific visualization can clarify data’s relationships in time and space.
In this visualization, the issue of the declining sea ice near the North Pole is set in its natural configuration. An analysis of the age of the Arctic sea ice indicates that it traditionally became older while circulating in the Beaufort Sea north of Alaska and was then primarily lost in the warmer regions along the eastern coast of Greenland. In recent years, however, warmer water in the Beaufort Sea, possibly from the Bering Strait, often melts away the sea ice in the summer before it can get older.
The same as the above visualization without the title and arrow overlays. This version has no audio.

An image showing how the Arctic sea ice used to circulate for many years in the Beaufort Gyre north of Alaska getting older and thicker over time.
An image showing how the sea ice moves out of the Arctic Ocean through the Fram Strait and into the North Atlantic where it melts.
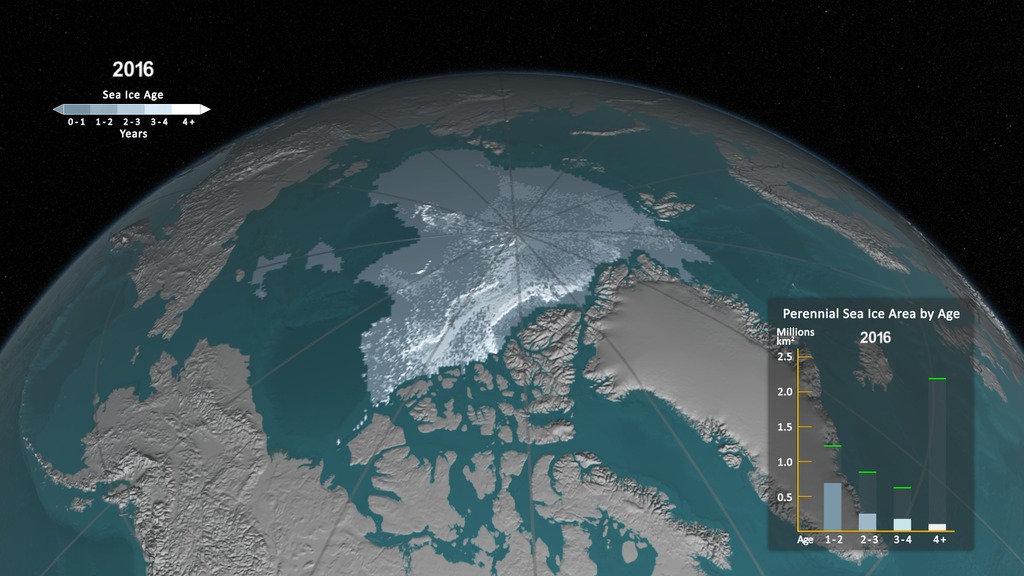
This image shows the difference in the quantity of the older sea ice from September 1984 to September 2016.
An image showing the Arctic sea ice age in September 1984.
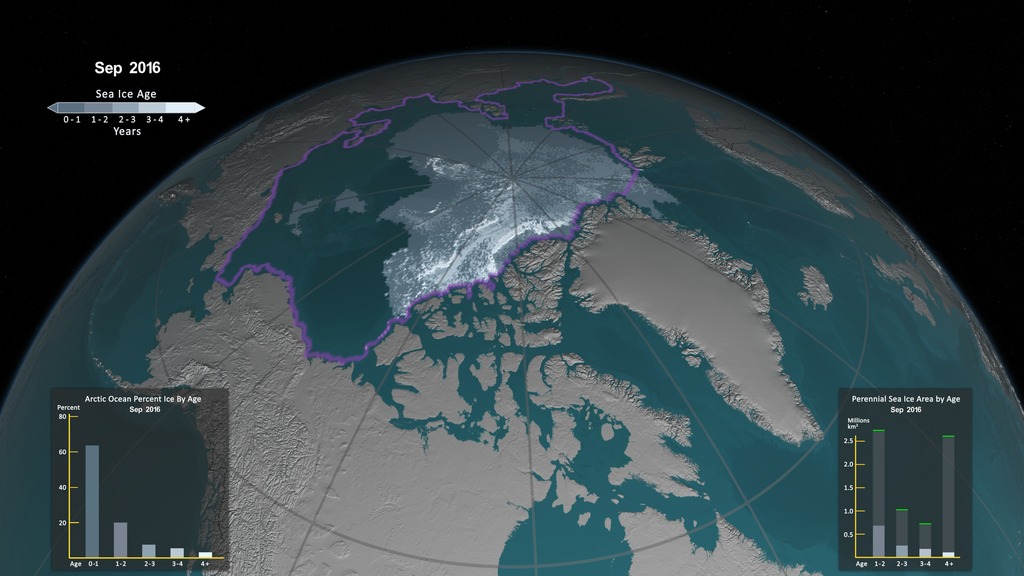
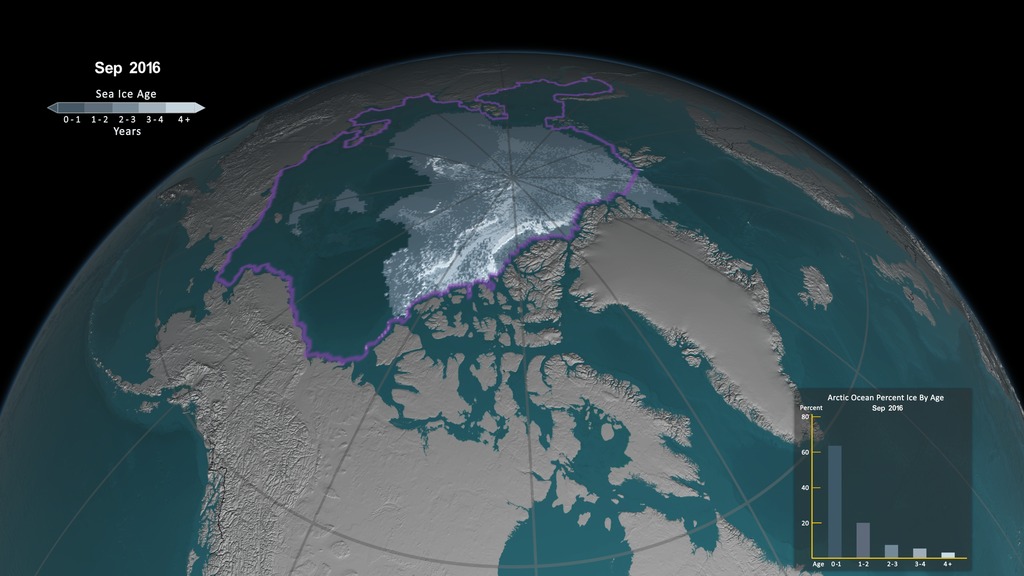
An image showing the Arctic sea ice age in September 2016.
The initial visualization showing the dynamic beauty of the sea ice without dates.

The dates that correspond with the visualization above.
Credits
Please give credit for this item to:
NASA's Scientific Visualization Studio
-
Visualizer
- Cindy Starr (Global Science and Technology, Inc.)
-
Scientist
- Walt Meier (NASA/GSFC)
-
Narrators
- LK Ward (USRA)
- Walt Meier (NASA/GSFC)
-
Multimedia designer
- Horace Mitchell (NASA/GSFC)
-
Producers
- Stuart A. Snodgrass (KBR Wyle Services, LLC)
- LK Ward (USRA)
Release date
This page was originally published on Tuesday, March 13, 2018.
This page was last updated on Wednesday, November 15, 2023 at 12:11 AM EST.
Series
This visualization can be found in the following series:Datasets used in this visualization
-
10 km Daily Sea Ice Concentration [SHIZUKU (GCOM-W1): AMSR2]
ID: 795Credit: AMSR2 data courtesy of the Japan Aerospace Exploration Agency (JAXA).
See all pages that use this dataset -
10 km Daily 89 GHz Brightness Temperature [SHIZUKU (GCOM-W1): AMSR2]
ID: 796Credit: AMSR2 data courtesy of the Japan Aerospace Exploration Agency (JAXA).
See all pages that use this dataset -
Weekly Sea Ice Age
ID: 940SSMI-SSMIS passive microwave data, augmented with buoys, AVHRR, AMSR-E, and winds
See all pages that use this dataset
Note: While we identify the data sets used in these visualizations, we do not store any further details, nor the data sets themselves on our site.
Related
- ID: 4750
- ID: 13300
 Produced Video
 - ID: 4489
Alternate Versions
- ID: 4522
- ID: 4509
- ID: 4510
Used as a Source In
- ID: 13075
![Music: Haunting Memories by Emmanuel David Lipszyc [SACEM], Franck Lascombes [SACEM], Sébastien Lipszyc [SACEM]Complete transcript available.](/vis/a010000/a013000/a013075/sea_ice_min_w_avg_print_res_print.jpg)