A newer version of this visualization is available.
New island forms in Tonga
This visualization shows the change in the island of Hunga Tonga Hunga Ha'apa between January 2015 and September 2017.
This video is also available on our YouTube channel.
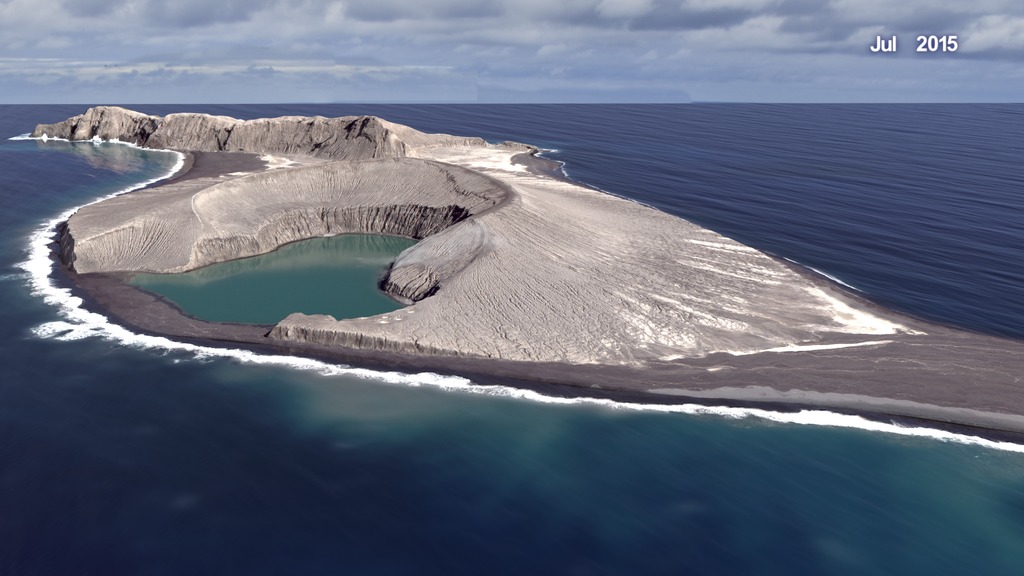
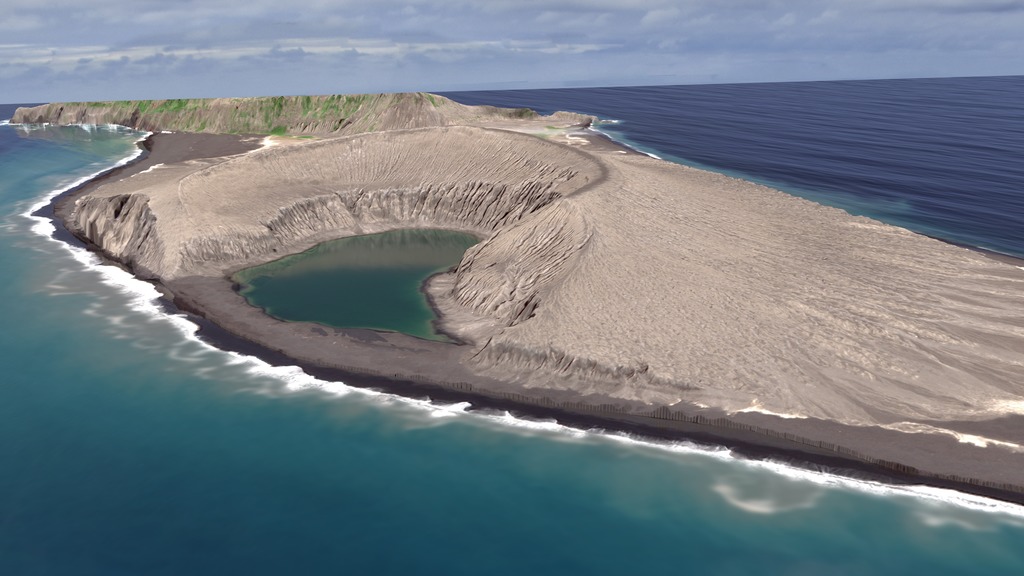
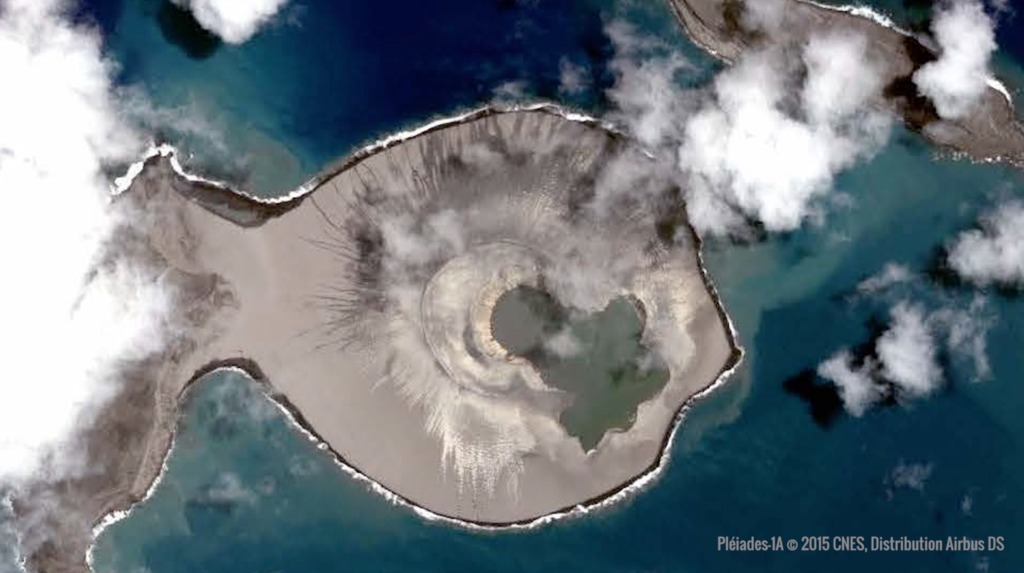
The evolution of the newly-erupted "surtseyan" island (~ 180 hectares in area) in the Kingdom of Tonga in the Southwestern Pacific is documented in a time-lapse sequences of perspective views using a time-series of DigitalGlobe WorldView images from just after the eruption ended in late January 2015 until late September 2017. These meter-resolution views were generated using Digital Elevation Models (DEMs) created by the NASA- led science team using stereo-pairs of DigitalGlobe Worldview images, and have allowed the erosional history of this unique island to be studied from a never-before-possible spaceborne perspective. The impact of marine abrasion on the somewhat fragile volcanic-ash landscapes is evident as the southern and southeastern margins of the new island, informally known as Hunga Tonga Hunga Ha'apai (HTHH), recede, while deposition of a widening isthmus grows to the northeast.
Research results from NASA-funded science team led by James B. Garvin (NASA GSFC), Daniel A. Slayback (SSAI), Vicki Ferrini (Columbia) recently submitted for publication in the AGU's Geophysical Research Letters journal suggest the island's lifetime may be extended for another 25-30 years if geochemical fortification continues to protect key regions. The HTHH island is the first surtseyan eruption-based island to have persisted as "new land" for more than 6 months since Surtsey erupted near Iceland in 1963. Studies of the landscape evolution of pristine volcanic islands of this variety previously relied on a combination of aerial photography, field mapping, and laboratory sample analysis, but this new work enables an optimized approach via advanced satellite optical and radar imaging in combination with ship-based bathymetric mapping. Results of this work can be applied to understanding numerous small volcanic landforms on Mars whose formation may have been in shallow-water environments during epochs when persistent surface water was present.
Field photography and sampling of the HTHH island "system" by French sailors who served as citizen geoscientists for the NASA project greatly enhanced the project and validated several key interpretations.
(Special thanks to NASA Earth Sciences RRNES program, French sailors Damien Grouille and Cecile Sabau of the sailing vessel Colibri, and to the Schmidt Ocean Institute R/V Falkor).
This movie begins with the visualization above and concludes showing video footage and photographs taken by Damiaen Grouille and Cecile Sabau on June 4th and 5th, 2017.
This video is also available on our YouTube channel.

This image shows the island as it appeared on September 19, 2017 with an outline of the initial extent of the island from January 2015.
This images shows the island as it appeared on September 19, 2017 with the semi-transparent overlay of the area that was eroded between January 2015 and September 2017.
This movie is identical to the first visualization on this page except that the simulated smoke depicting the volcanic eruption is not included in this version.
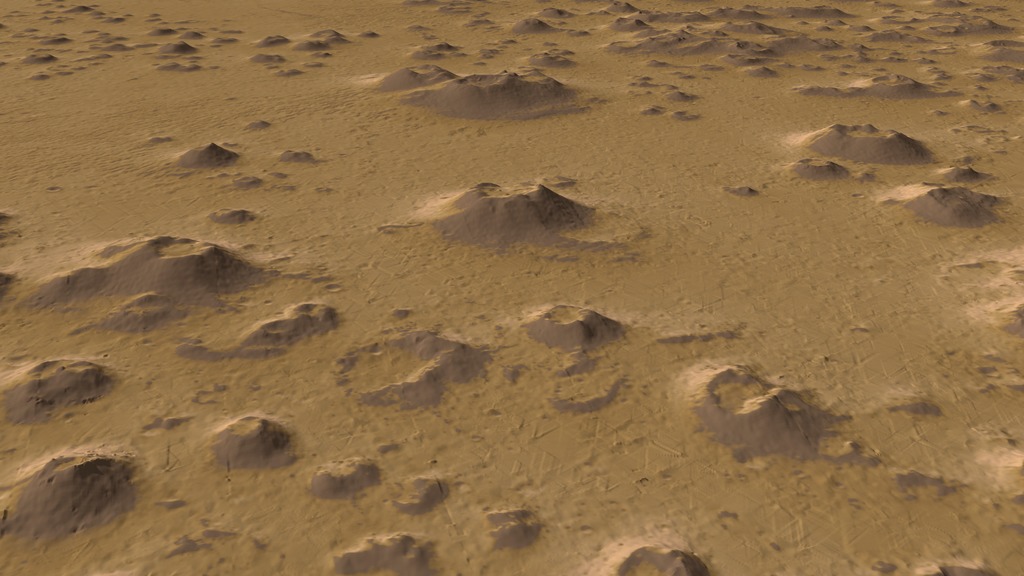
This is an image generated from a digital elevation model derived from stereo views of a Martian volcano. Data was collected from the HiRISE instrument aboard Mars Reconnaissance Orbiter. Study of HTHH may give us insights into how land forms like this formed on Mars two or three billion years ago.
Credits
Please give credit for this item to:
NASA's Scientific Visualization Studio
Research was largely supported by:
NASA Earth Science Division RRNES Program
(℅ Drs. Jack Kaye and Gerald Bawden)
and the Schmidt Ocean Institute
-
Visualizer
- Cindy Starr (Global Science and Technology, Inc.)
-
Scientists
- James Garvin (NASA, Chief Scientist Goddard)
- Daniel A. Slayback (SSAI)
- Vicki Ferrini (Lamont-Doherty Earth Observatory, Columbia University)
-
Producers
- Ellen T. Gray (ADNET Systems, Inc.)
- LK Ward (USRA)
- Samson K. Reiny (Wyle Information Systems)
-
Project support
- Joycelyn Thomson Jones (NASA/GSFC)
- Leann Johnson (Global Science and Technology, Inc.)
- Eric Sokolowsky (Global Science and Technology, Inc.)
-
Technical support
- Laurence Schuler (ADNET Systems, Inc.)
- Ian Jones (ADNET Systems, Inc.)
-
Citizen scientists
Release date
This page was originally published on Monday, December 11, 2017.
This page was last updated on Wednesday, November 15, 2023 at 12:11 AM EST.
Papers used in this visualization
https://agupubs.onlinelibrary.wiley.com/doi/abs/10.1002/2017GL076621
Datasets used in this visualization
-
HiRISE [Mars Reconnaissance Orbiter (MRO): High Resolution Imaging Science Experiment (HiRISE)]
ID: 898 -
WorldView-2 © 2015 DigitalGlobe
ID: 991 -
WorldView-3 © 2015 DigitalGlobe
ID: 992 -
WorldView-2 © 2016 DigitalGlobe
ID: 993 -
WorldView-3 © 2016 DigitalGlobe
ID: 994 -
WorldView-2 © 2017 DigitalGlobe
ID: 995 -
WorldView-2 © 2010 DigitalGlobe
ID: 996 -
Pléiades-1A © 2015 CNES, Distribution Airbus DS
ID: 997
Note: While we identify the data sets used in these visualizations, we do not store any further details, nor the data sets themselves on our site.
Related
- ID: 4635
- ID: 12784
 Produced Video
Newer Versions
- ID: 4726
 Visualization
Used as a Source In
- ID: 4742
 Visualization
 - ID: 12800
 Produced Video