Hurricane Tracks from 2017 with Precipitation and Cloud Data
2017 Atlantic Hurricane season storm tracks with IMERG precipitation and GOES clouds (01 Aug 2017 to 31 Oct 2017)
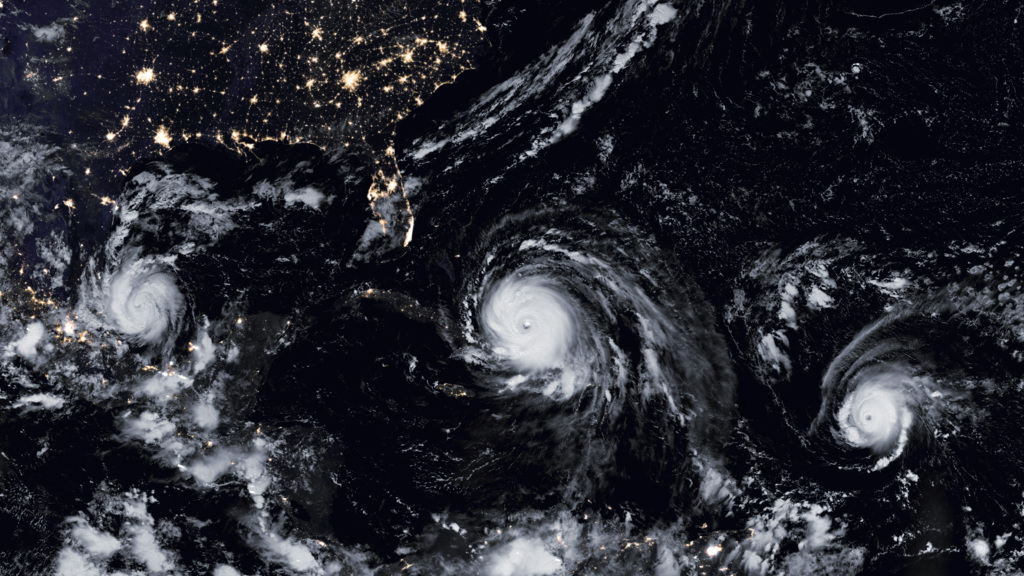
These visualizations show the tracks of Atlantic hurricanes during 2017. Data from the Global Precipitation Mission called IMERG is used to show rainfall and data from NOAA's GOES East shows clouds. Storm position and wind speed data from UNISYS are used to show the track lines. The numbers 1 through 5 as well as "T" are displayed when storms change categories. The "T" stands for tropical storm.
There are 2 visualizations at various resolutions:
- a wide Atlantic view that shows all of the hurricane tracks
- a view that follows and zooms in only on Hurricane Harvey
These visualizaitons were created to support NASA talks given at the National Air and Space Musuem (NASM) in October 2017. The wide Atlantic view was updated at the end of hurricane season to include all Atlantic hurricanes in 2017 for display at the American Geophysical Union (AGU) conference.
These visualizations only go through October 2017 because there were no Atlantic hurricanes in November or December 2017.
Hurricane Harvey storm track with IMERG precipitation and GOES clouds (2017 Aug 16 to 2017 Sep 01)
Credits
Please give credit for this item to:
NASA's Scientific Visualization Studio
-
Visualizers
- Greg Shirah (NASA/GSFC)
- Horace Mitchell (NASA/GSFC)
- Alex Kekesi (Global Science and Technology, Inc.)
- Kel Elkins (USRA)
-
Technical support
- Laurence Schuler (ADNET Systems, Inc.)
- Ian Jones (ADNET Systems, Inc.)
-
Scientist
-
Producer
- Matthew R. Radcliff (USRA)
-
Writer
- Patrick Lynch (NASA/GSFC)
Release date
This page was originally published on Thursday, October 5, 2017.
This page was last updated on Wednesday, November 15, 2023 at 12:11 AM EST.
Series
This visualization can be found in the following series:Datasets used in this visualization
-
GTOPO30 Topography and Bathymetry
ID: 274 -
Hurricane/Tropical Data
ID: 282 -
CPC (Climate Prediction Center) Cloud Composite
ID: 600Global cloud cover from multiple satellites
See all pages that use this dataset -
IMERG
ID: 863This dataset can be found at: http://pmm.nasa.gov/sites/default/files/document_files/IMERG_ATBD_V4.4.pdf
See all pages that use this dataset
Note: While we identify the data sets used in these visualizations, we do not store any further details, nor the data sets themselves on our site.
Used as a Source In
- ID: 12733
 Produced Video