Using Satellite and Ground-based Data to Develop Malaria Risk Maps
Malaria is a major problem in the Amazon where malaria mosquitoes tend to prefer wet, hot areas with more standing water. Seasonal occupational movement along rivers and in forested areas increases transmission and concentrates malaria in specific regions.
The objective of Malaria Project, an ongoing study led by William Pan and Ben Zaitchik, is to develop a detection and early warning system for malaria risk in the Amazon. Using data from NASA satellites and a Land Data Assimilation System (LDAS), the scientists hope that their research can help health officials pinpoint where to deploy resources and what resources to deploy during a disease outbreak.
By incorporating NASA data such as precipitation, soil moisture, air temperature, and humidity into their new system, scientists are better able to predict where malaria-spreading mosquitoes are breeding. These climate factors in conjunction with a population density and human movement model will help scientists better understand where and when people are at high risk for malaria. The malaria warning system will predict outbreaks and simulate response to help a country's health care system to more strategically determine where to deploy their resources.
Visualizations focus on Peru, one of the central areas of malaria transmission in the Amazon. Four LDAS data sets -- precipitation, soil moisture, air temperature, and humidity are illustrated below. Combined with public health data, the animations show how these factors may affect the outbreak and evolvement of the disease.
Locations in Peru where malaria cases were reported in 2005

The color bar for reported malaria cases (shown as cylinders) from 1 to 100, going from light red to dark red.
The LDAS precipitation data in 2005.
The color bar for precipitation rate from 0.0 to 0.0042 kilogram in one square meter per second, going from light blue to dark blue.
The LDAS data - total soil moisture in 2005.
The color bar for total soil moisture from 2.9 to 1000 kg per square meter, going from light green to dark green.
The LDAS humidity data in 2005.
The color bar for special humidity from 0.0 to 0.023 kilogram per kilogram, going from light blue to purple to dark purple.
The LDAS air temperature data in 2005.
The color bar for air temperature from 264.93 to 309.25 Kelvin, going from light blue to light brown to dark brown.
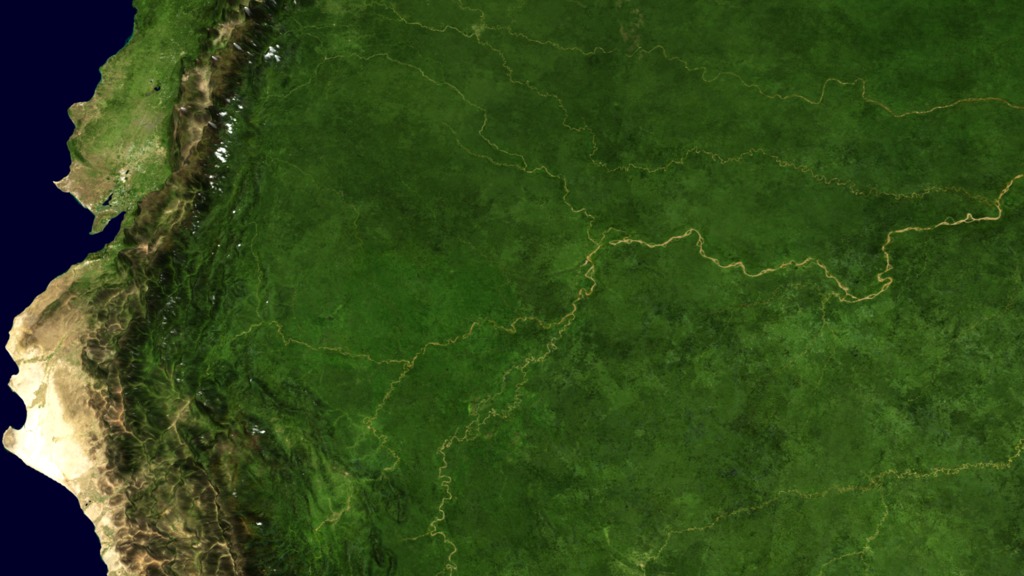
These are the frames of the background/land cover as the camera zooms in.
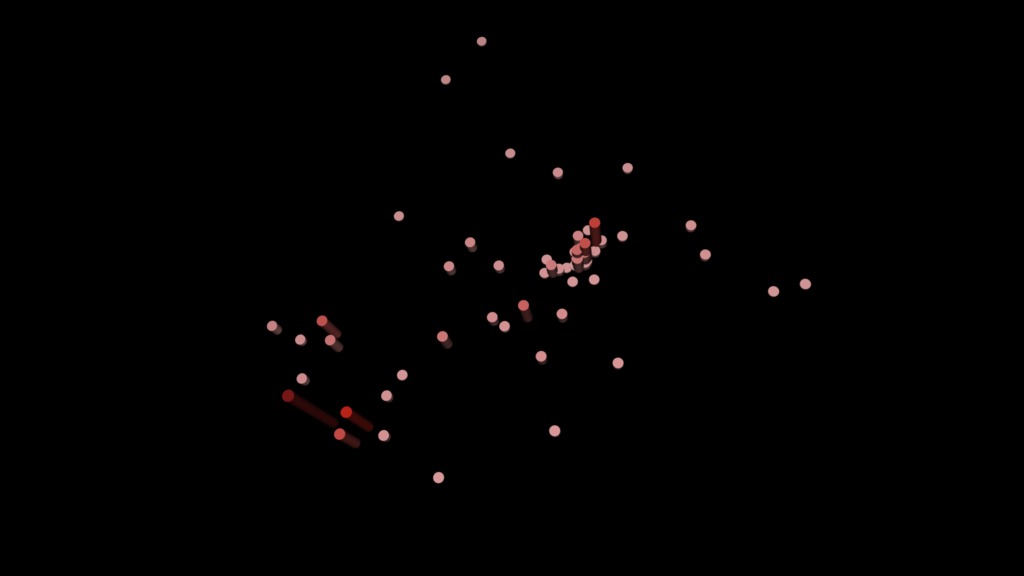
The layer of reported malaria cases shown as cylinders.
These are the frames of the matching mask for Peru as the camera zooms in.
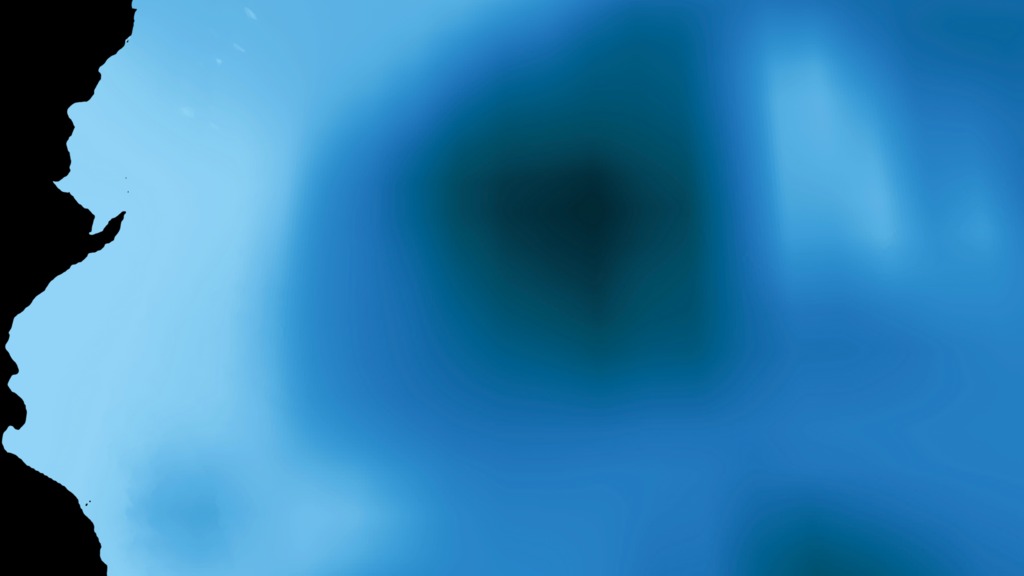
The frames of LDAS precipitation layer.
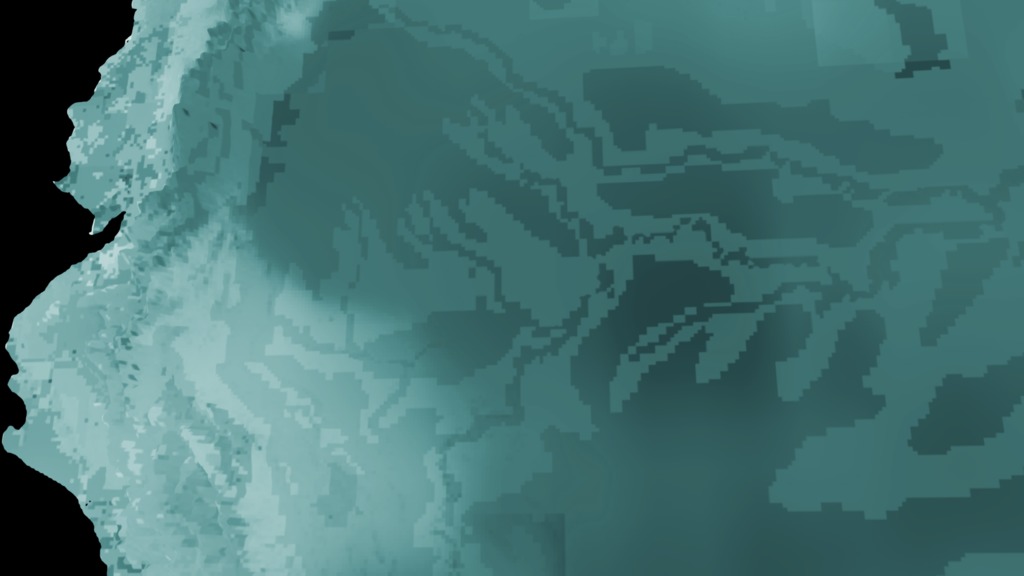
The frames of LDAS total soil moisture.
The frames of LDAS air temperature.

The frames of LDAS humidity.

The frames of date in mmddyyyy format.

These are the frames of date in week and year format. This format is original in the health-post level dataset.
The river mask for the malaria area.
Credits
Please give credit for this item to:
NASA's Scientific Visualization Studio
-
Visualizers
- Cheng Zhang (USRA)
- Horace Mitchell (NASA/GSFC)
- Greg Shirah (NASA/GSFC)
-
Producers
- Joy Ng (USRA)
- Ryan Fitzgibbons (USRA)
-
Scientists
- William Pan
- Ben Zaitchik (Johns Hopkins University)
-
Writer
- Samson K. Reiny (Wyle Information Systems)
-
Technical support
- Laurence Schuler (ADNET Systems, Inc.)
- Ian Jones (ADNET Systems, Inc.)
Release date
This page was originally published on Monday, July 24, 2017.
This page was last updated on Wednesday, November 15, 2023 at 12:11 AM EST.
Datasets used in this visualization
-
BMNG (Blue Marble: Next Generation) [Terra and Aqua: MODIS]
ID: 508Credit: The Blue Marble data is courtesy of Reto Stockli (NASA/GSFC).
This dataset can be found at: http://earthobservatory.nasa.gov/Newsroom/BlueMarble/
See all pages that use this dataset -
Land Data Assimilation System (LDAS)
ID: 777 -
health-post level dataset
ID: 979
Note: While we identify the data sets used in these visualizations, we do not store any further details, nor the data sets themselves on our site.
Used as a Source In
- ID: 12603
![Complete transcript available.Music credits: ‘Inner Confusion’ by Laurent Levesque [SACEM], ‘The Awakening’ by Benjamin Krause [GEMA], Scott Goodman [ASCAP], ‘Cellular Signals’ by Laurent Levesque [SACEM]Watch this video on the NASA Goddard YouTube channel.](/vis/a010000/a012600/a012603/LARGE_MP4-12603_PredictingMalaria_large.00183_print.jpg) Produced Video
Produced Video