El Yunque National Forest, Puerto Rico Canopy Change Up Close (2017-2018)
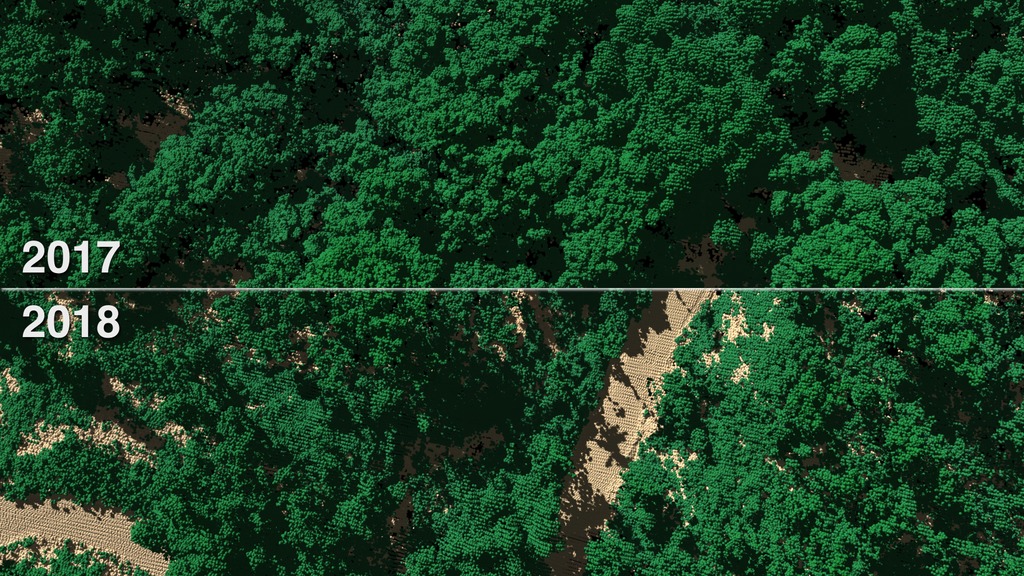
Sample composite that shows a split screen of 2017 and 2018 lidar data over El Yunque National Forest, Puerto Rico. As the animation plays, one can see a distinct difference between the fullness of the 2017 forest canopy versus the much sparser 2018 canopy. This difference is most noticable around rivers and streams where the neighboring forest canopy was stripped away by Hurricane Maria exposing much more of the water banks.
In September 2017, Hurricane Maria's lashing rain and winds also transformed Puerto Rico's lush tropical rainforest landscape. Research scientist Doug Morton of Goddard was part of the team of NASA researchers who had surveyed Puerto Rico's forests six months before the storm. The team used Goddard’s Lidar, Hyperspectral, and Thermal (G-LiHT) Airborne Imager, a system designed to study the structure and species composition of forests. Shooting 600,000 laser pulses per second, G-LiHT produces a 3D view of the forest structure in high resolution, showing individual trees in high detail from the ground to treetop. In April 2018 (post-Maria) the team went back and surveyed the same tracks as in 2017 (before Maria).
The extensive damage to Puerto Rico's forests had far-reaching effects, Morton said. Fallen trees that no longer stabilize soil on slopes with their roots as well as downed branches can contribute to landslides and debris flows, increased erosion, and poor water quality in streams and rivers where sediments build up.
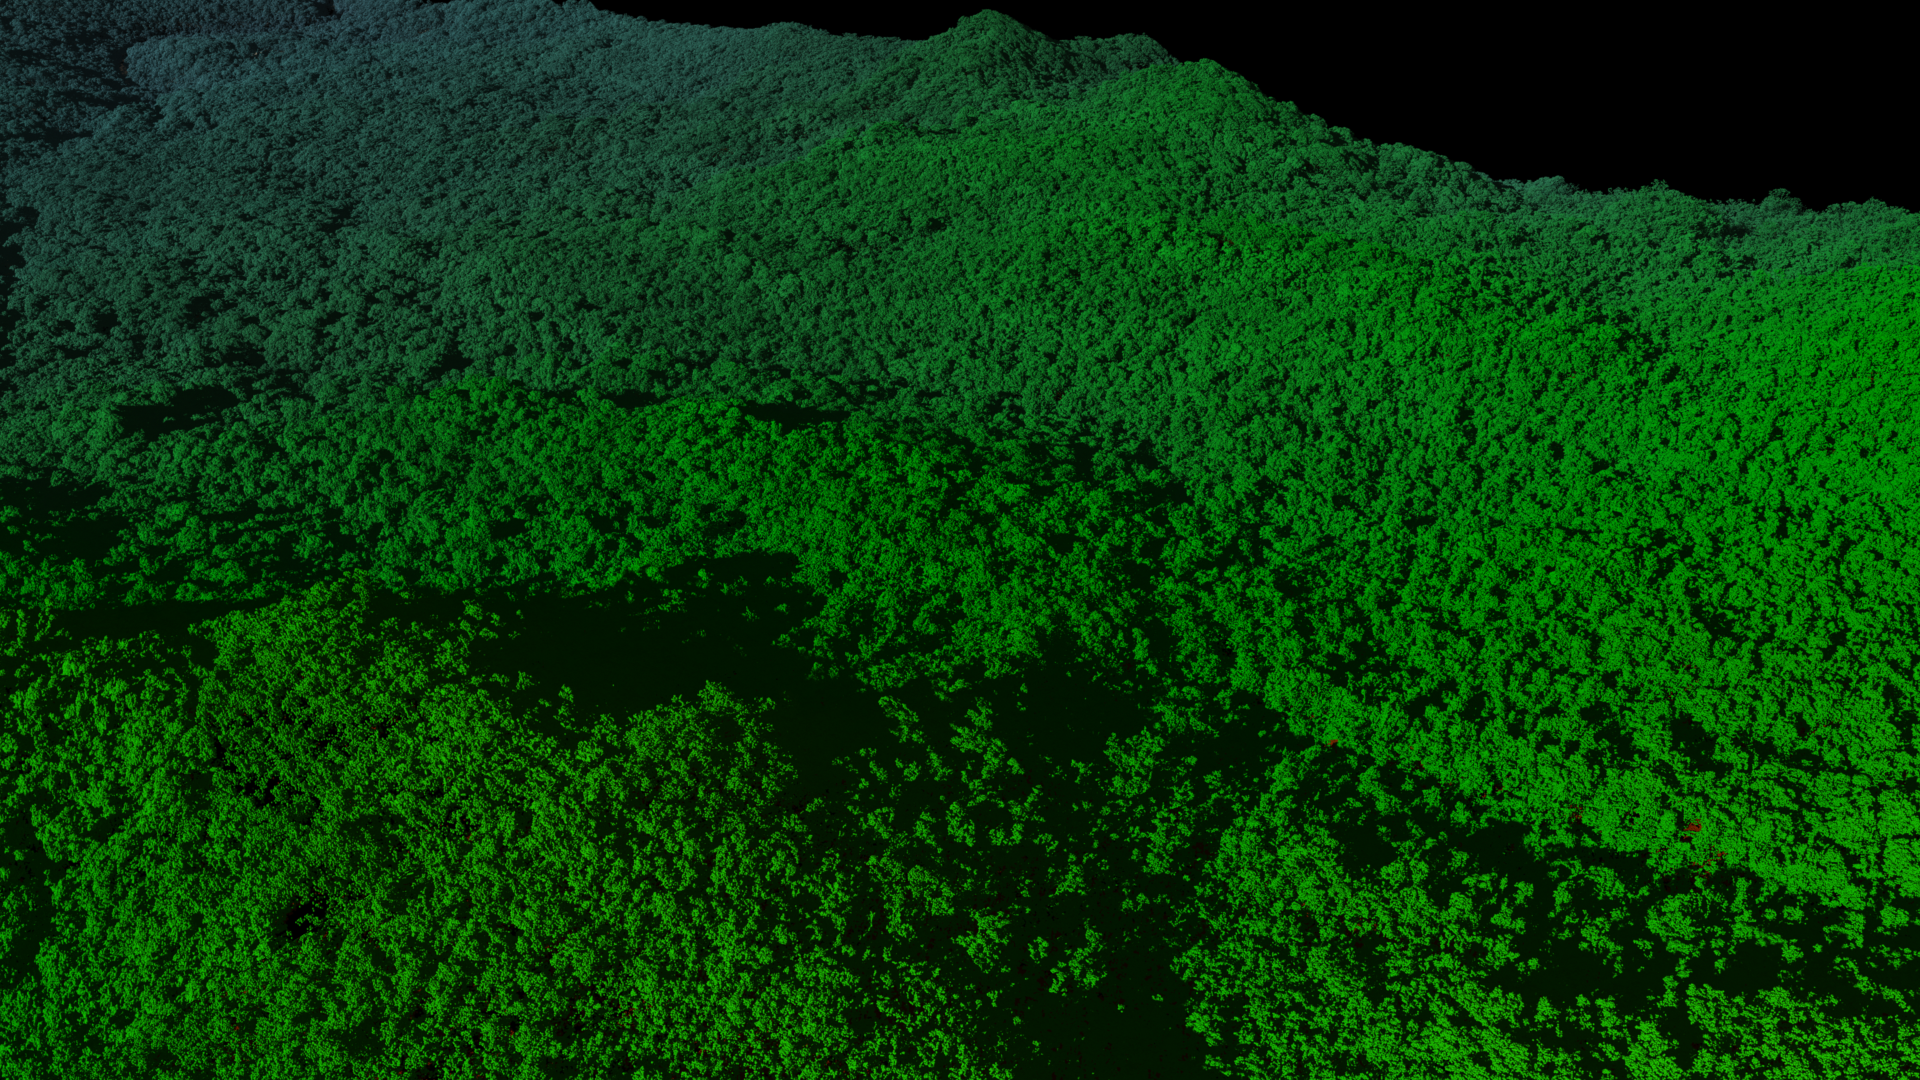
2017 Lidar traverse of El Yunque National Forest, Puerto Rico six months before Hurricane Maria hit. Notice the full lush tree canopy that allows very little ground exposure.
2018 Lidar traverse of El Yunque National Forest, Puerto Rico. Notice the jagged sparser nature of the tree canopy after Hurricane Maria hit in late 2017. Much more ground has also been exposed.
Credits
Please give credit for this item to:
NASA's Scientific Visualization Studio
-
Data visualizers
- Alex Kekesi (Global Science and Technology, Inc.)
- Greg Shirah (NASA/GSFC)
- Horace Mitchell (NASA/GSFC)
- Cindy Starr (Global Science and Technology, Inc.)
-
Producer
- Matthew R. Radcliff (USRA)
-
Writer
- Ellen T. Gray (ADNET Systems, Inc.)
-
Scientist
- Doug C. Morton (NASA/GSFC)
-
Data provider
- Hyeungu Choi (Global Science and Technology, Inc.)
-
Technical support
- Laurence Schuler (ADNET Systems, Inc.)
- Ian Jones (ADNET Systems, Inc.)
Release date
This page was originally published on Monday, December 10, 2018.
This page was last updated on Wednesday, November 15, 2023 at 12:10 AM EST.
Series
This visualization can be found in the following series:Datasets used in this visualization
-
LiDAR (LiDAR 3D point cloud) [Airplane: G-LiHT]
ID: 965
Note: While we identify the data sets used in these visualizations, we do not store any further details, nor the data sets themselves on our site.
Related
- ID: 4735

- ID: 12590
![To get a detailed look at vegetation and land cover, NASA uses an airborne instrument called Goddard’s Lidar, Hyperspectral and Thermal Airborne Imager, or G-LiHT. From the belly of a small aircraft flying one thousand feet above the trees, G-LiHT collects multiple measurements of forests, including high-resolution photographs, surface temperatures and the heights and structure of the vegetation. Watch this video on the NASA Goddard YouTube channel.Complete transcript available.Music: Letting the Past Go, by Ben Hales [PRS], Matt Hales [PRS]](/vis/a010000/a012500/a012590/12590_Puerto_Rico_lidar_youtube_1080.00248_print.jpg) Produced Video
Produced Video
Alternate Versions
- ID: 4621
- ID: 4624