Operation Icebridge Studies Changes in Greenland's Helheim Glacier
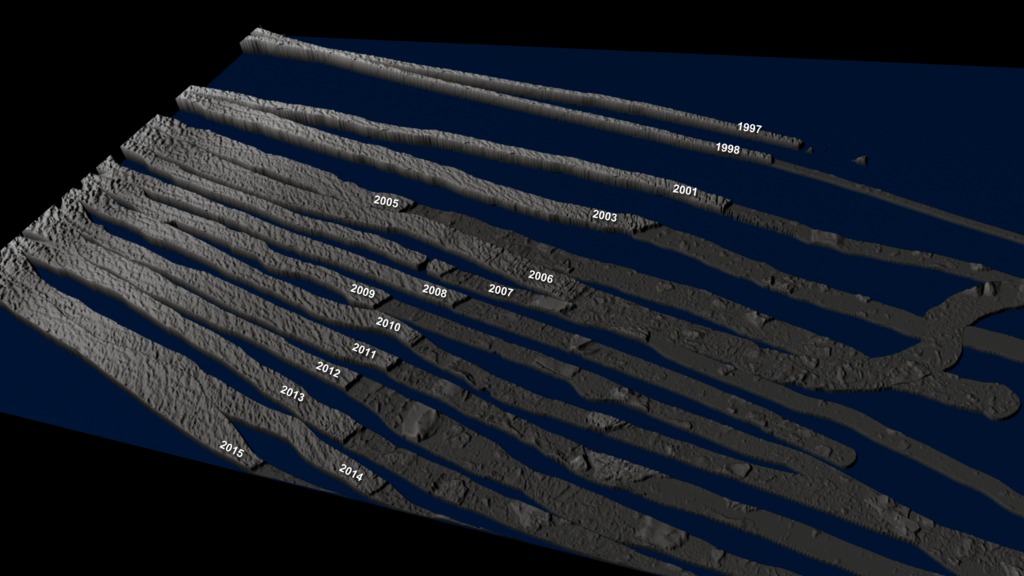
Flying down the Helheim Glacier in Greenland as ATM altimetry date is shown - first with data from 1998 then data from 2013 is added
These visualizations show data from the Helheim Glacier in Greenland collected by Pre-Icebridge in 1998 and Operation Icebridge in 2013. Data from both the Airborne Topographic Mapper (ATM) and the Digital Mapping System (DMS) are included.
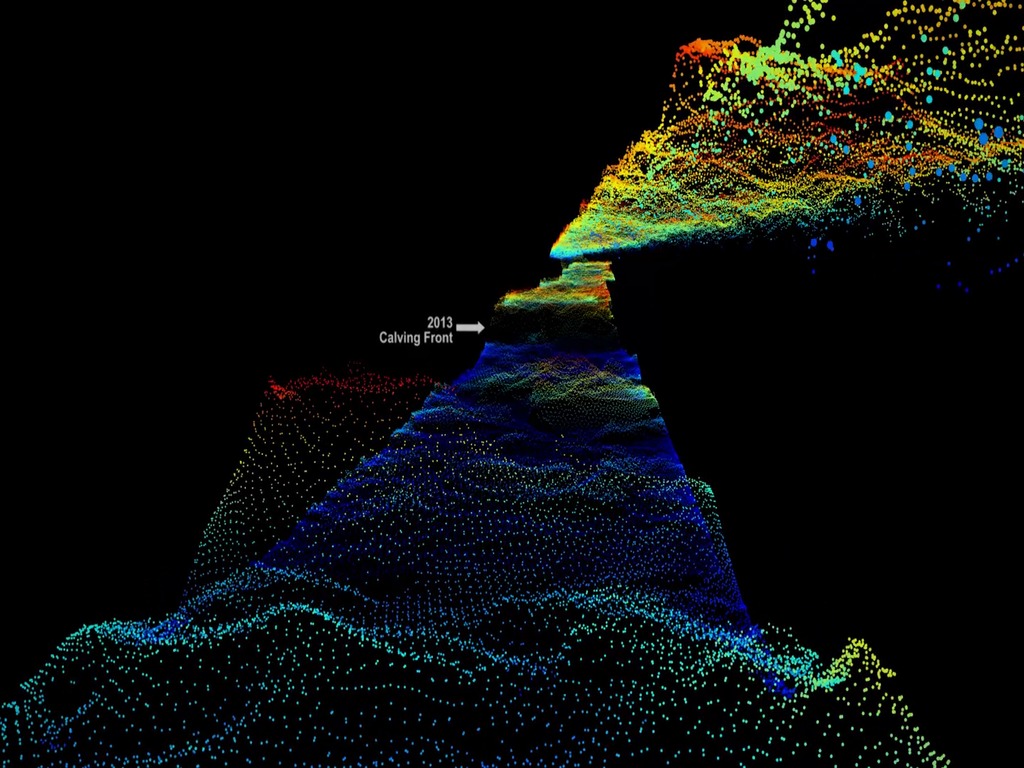
The first visualization shows how the scanner on the aircraft acquired the data, building up a representation of the 3d laser scanned points as we go. Once the calving front from 1998 is revealed, the 2013 data is faded in showing the differences between the years. The dots are colored initially by absolute height with reds higher and blues lower; after the 2013 data is added, the dot colors change to a localized scheme with reds higher than nearby points and blues lower than nearby points. ATM data is added at the end for some context.
The second visualization shows the DMS data with ATM data at the 2013 calving front. The DMS data is overlayed onto photogrametrically determined altitudes which don't precisely correspond to the ATM data. The heights of the ATM data are the 'true' heights.
ATM and DMS data from 2013 near the calving front
Rotate around particle representation of ATM data
Credits
Please give credit for this item to:
NASA's Scientific Visualization Studio
-
Visualizer
- Greg Shirah (NASA/GSFC)
-
Technical support
- Laurence Schuler (ADNET Systems, Inc.)
- Ian Jones (ADNET Systems, Inc.)
-
Producer
- Jefferson Beck (USRA)
-
Scientist
- Michael Studinger (NASA/GSFC)
Release date
This page was originally published on Friday, July 28, 2017.
This page was last updated on Wednesday, November 15, 2023 at 12:10 AM EST.
Missions
This visualization is related to the following missions:Series
This visualization can be found in the following series:Datasets used in this visualization
-
DMS Photogrammetry [Digital Mapping System]
ID: 729 -
L1B Elevation and Return Strength, Version 2 (2013 data) [IceBridge: ATM]
ID: 981This dataset can be found at: https://nsidc.org/data/docs/daac/icebridge/ilatm1b/
See all pages that use this dataset -
L1B Qfit Elevation and Return Strength, Version 1 (1998 data) [Pre-IceBridge: ATM]
ID: 982This dataset can be found at: http://nsidc.org/data/BLATM1B/versions/1
See all pages that use this dataset
Note: While we identify the data sets used in these visualizations, we do not store any further details, nor the data sets themselves on our site.
Related
- ID: 4348
Used as a Source In
- ID: 12204
 Produced Video