Arctic Daily Sea Ice Concentration from Arctic Minimum 2016 to Arctic Maximum 2017
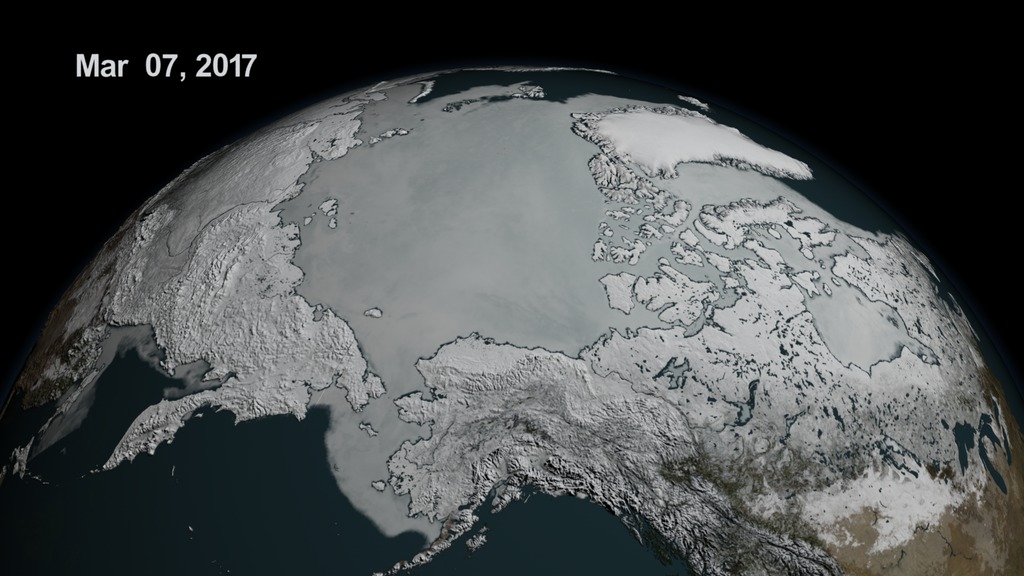
This movie begins at Arctic Minimum on September 10, 2016 and shows daily sea ice concentration until the Arctic maximum on March 7, 2017. The 2017 Arctic maximum was 14.42 million square kilometers (5.57 million square miles). The average maximum (1981-2010) is 15.64 million square kilometers.
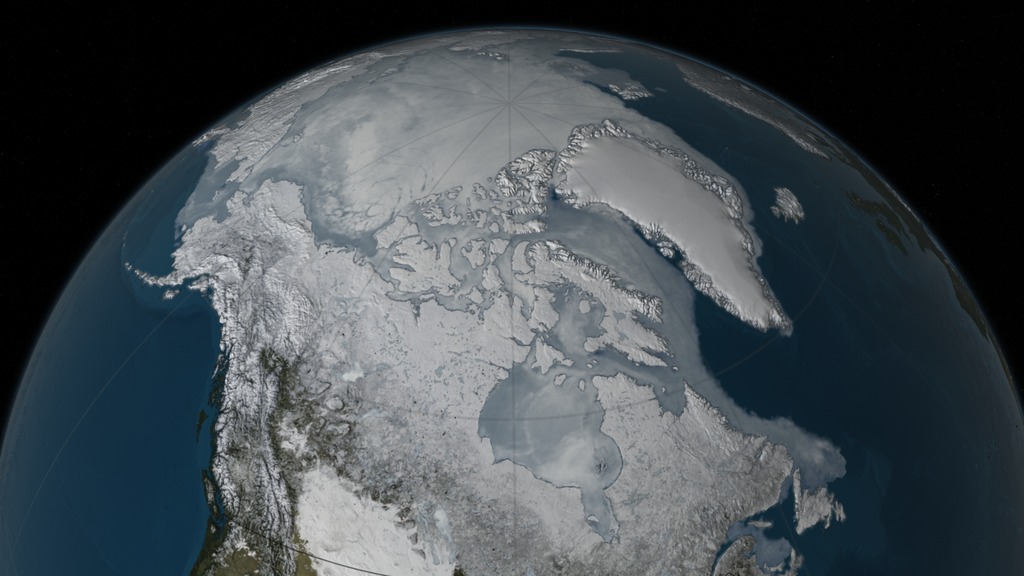
This animation shows the seasonal change in the extent of the Arctic sea ice between the Arctic minimum, September 10, 2016, and Arctic maximum on March 7, 2017.
Arctic sea ice appears to have reached a record low wintertime maximum extent, according to scientists at NASA and the NASA-supported National Snow and Ice Data Center (NSIDC) in Boulder, Colo. This winter, a combination of warmer-than-average temperatures, winds unfavorable to ice expansion, and a series of storms halted sea ice growth in the Arctic. This year’s maximum extent, reached on March 7 at 5.57 million square miles (14.42 million square kilometers), is only about 40,000 square miles below the previous record low, which occurred in 2016,
The images shown here portray the sea ice as it was observed by the AMSR2 instrument onboard the Japanese Shizuku satellite. The opacity of the sea ice is derived from the AMSR2 sea ice concentration. The blueish white color of the sea ice is derived from the AMSR2 89 GHz brightness temperature. The annual cycle starts with the minimum extent reached on August 31, 2016 and runs through the daily sea ice concentration until the maximum occurs on March 3, 2017. The Arctic’s sea ice maximum extent has dropped by an average of 2.8 percent per decade since 1979, the year satellites started measuring sea ice. The summertime minimum extent losses are nearly five times larger: 13.5 percent per decade. Besides shrinking in extent, the sea ice cap is also thinning and becoming more vulnerable to the action of ocean waters, winds and warmer temperatures.

The Arctic sea ice extent minimum on September 10, 2016.
The Arctic sea ice movie extended through July 2017.
Credits
Please give credit for this item to:
NASA's Goddard Space Flight Center Scientific Visualization Studio
The Blue Marble data is courtesy of Reto Stockli (NASA/GSFC).
Data Citation for Greenland DEM: Howat I.M., A. Negrete, T. Scambos, T. Haran, in prep, A high-resolution elevation model for the Greenland Ice Sheet from combined stereoscopic and photoclinometric data.
-
Visualizers
- Lori Perkins (NASA/GSFC)
- Cindy Starr (Global Science and Technology, Inc.)
-
Scientists
- Walt Meier (NASA/GSFC)
- Robert Gersten (Wyle Information Systems)
- Claire Parkinson (NASA/GSFC)
-
Producers
- Kathryn Mersmann (USRA)
- Jefferson Beck (USRA)
-
Project support
- Laurence Schuler (ADNET Systems, Inc.)
- Ian Jones (ADNET Systems, Inc.)
Release date
This page was originally published on Wednesday, March 22, 2017.
This page was last updated on Tuesday, November 14, 2023 at 12:09 AM EST.
Missions
This visualization is related to the following missions:Datasets used in this visualization
-
GTOPO30 Topography and Bathymetry
ID: 274 -
BMNG (Blue Marble: Next Generation) [Terra and Aqua: MODIS]
ID: 508Credit: The Blue Marble data is courtesy of Reto Stockli (NASA/GSFC).
This dataset can be found at: http://earthobservatory.nasa.gov/Newsroom/BlueMarble/
See all pages that use this dataset -
Comiso's Daily Sea Ice Concentration
ID: 539 -
Land Cover [Terra and Aqua: MODIS]
ID: 556 -
GIMP Greenland DEM (Greenland Mapping Project (GIMP) Digital Elevation Model)
ID: 746
Note: While we identify the data sets used in these visualizations, we do not store any further details, nor the data sets themselves on our site.
Related
- ID: 12537
![Music: Crystal Light by Michael Holborn [PRS] and William Henries [PRS]Complete transcript available.](/vis/a010000/a012500/a012537/LARGE_MP4-12537_ArcticSeaIceMax_2017_large.00624_print.jpg) Produced Video
Produced Video
Older Versions
- ID: 4440
 Visualization
Used as a Source In
- ID: 12480
 Produced Video