Atmospheric River Slams California
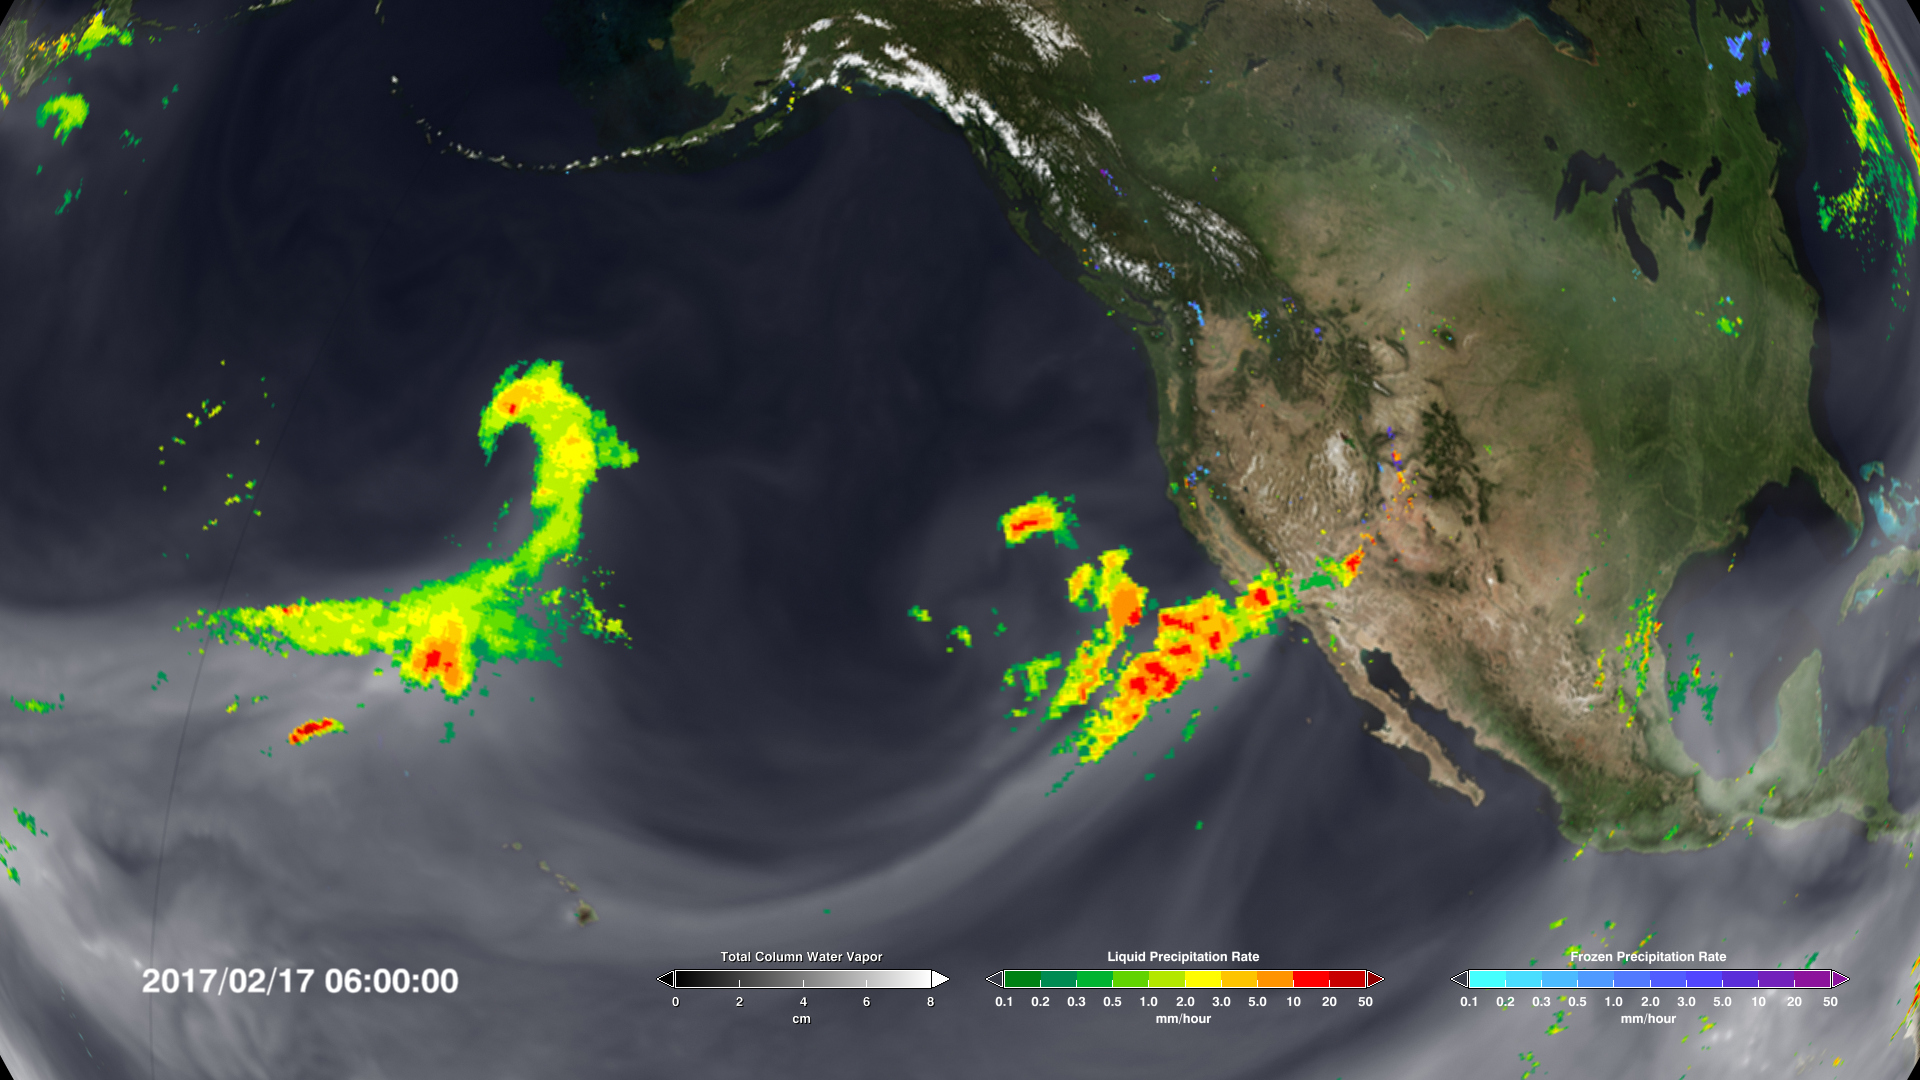
This visualization combines precipitation data from the Global Precipitation Measurement (GPM) mission's Integrated Multi-satellitE Retrievals (IMERG) and water vapor data from Goddard Earth Observing System Model (GEOS) . Together, they allow scientists to study atmospheric rivers and the heavy precipitation they bring to California.
This video is also available on our YouTube channel.
After more than four years of drought, Californians may wonder where the current rain is coming from. Using satellites, NASA scientists have a unique view of the sources of precipitation, and how it reaches the western United States.
Rain is often carried by narrow tendrils of moisture called atmospheric rivers that occur all over the world, shown here in white. The atmospheric rivers that affect the western United States are known as the Pineapple Express because they transport water vapor from as far south as Hawaii to California. When the moisture reaches land, it is forced up over the hills and mountains where it cools, producing significant rainfall. This type of precipitation provides about 40 percent of the state’s annual water supply.
A global view of the IMERG precipitation and GEOS water vapor in the first half of January 2017. Note that atmospheric river events occur not just in California, but all over the world in the mid-latitude regions.

Color bar for liquid precipitation
Colorbar for frozen precipitation
Credits
Please give credit for this item to:
NASA's Scientific Visualization Studio
-
Visualizer
- Horace Mitchell (NASA/GSFC)
-
Scientist
- George Huffman (NASA/GSFC)
Release date
This page was originally published on Monday, January 23, 2017.
This page was last updated on Tuesday, November 14, 2023 at 12:08 AM EST.
Series
This visualization can be found in the following series:Datasets used in this visualization
-
GEOS Atmospheric Model
ID: 665 -
IMERG
ID: 863This dataset can be found at: http://pmm.nasa.gov/sites/default/files/document_files/IMERG_ATBD_V4.4.pdf
See all pages that use this dataset
Note: While we identify the data sets used in these visualizations, we do not store any further details, nor the data sets themselves on our site.
Used as a Source In
- ID: 12471
 Produced Video