ICON and GOLD: Instrument Scanning Coverage
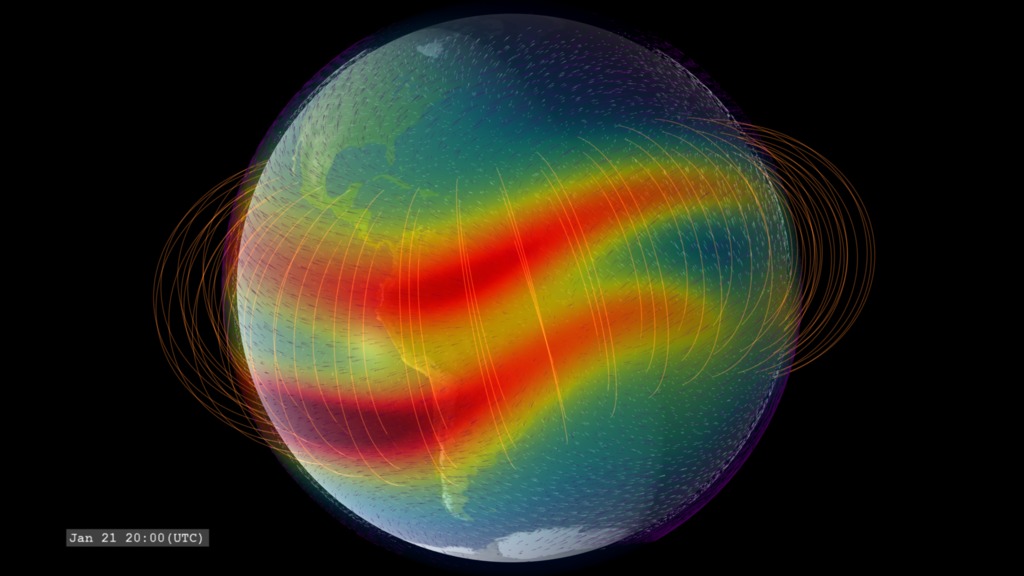
Visualization of ICON and GOLD orbiting Earth with image scanning. This version presents several geospace models, including the singly-ionized oxygen density, the low-latitude geomagnetic field, and the high-altitude winds (100km and 350km altitudes).
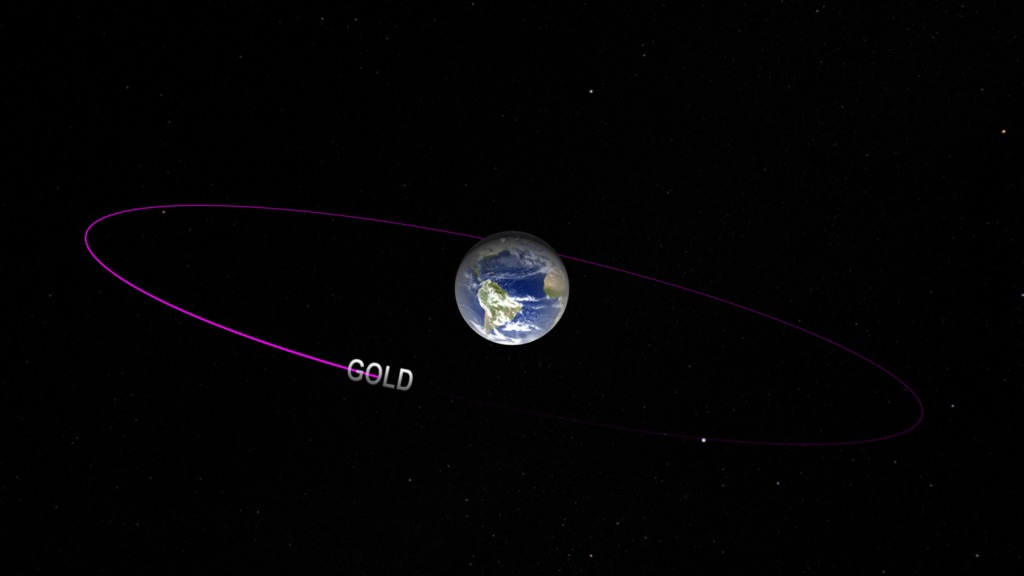
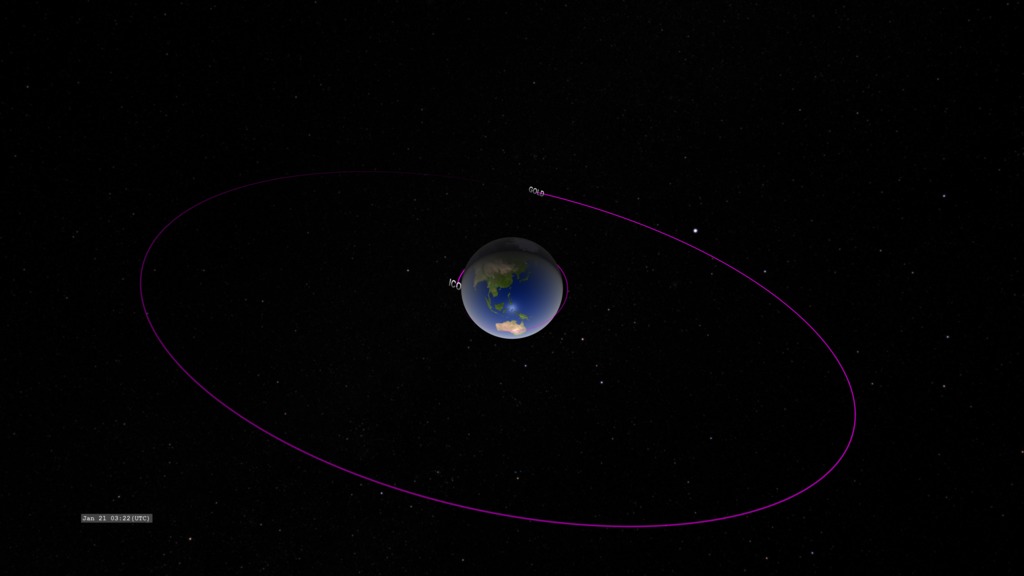
A basic view of the orbits for ICON (Ionospheric Connections Explorer) and GOLD (Global-scale Observations of the Limb and Disk). These missions will conduct measurements of ionospheric composition, ionization, and winds to better understand the connection between space weather and its terrestrial impacts.
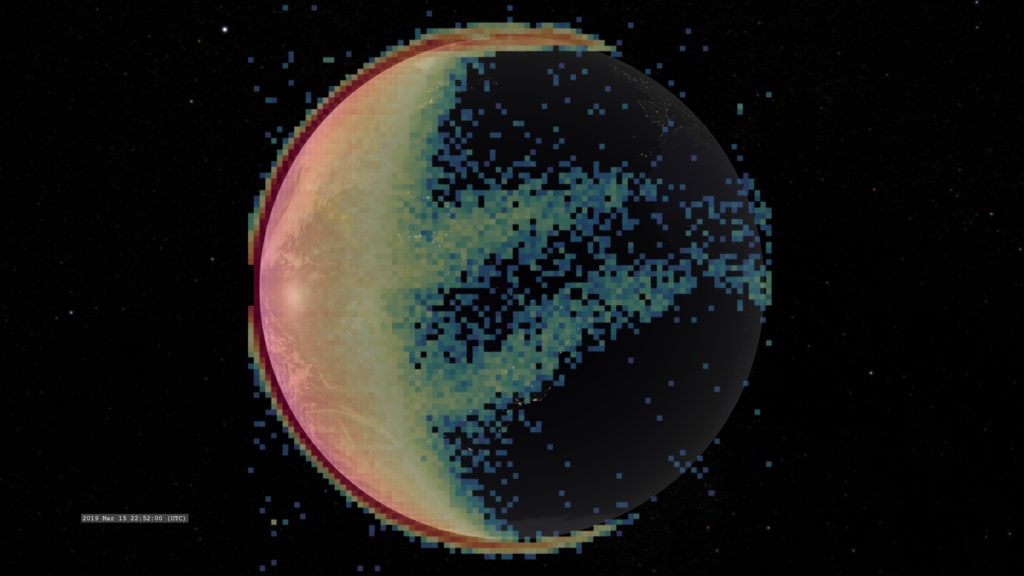
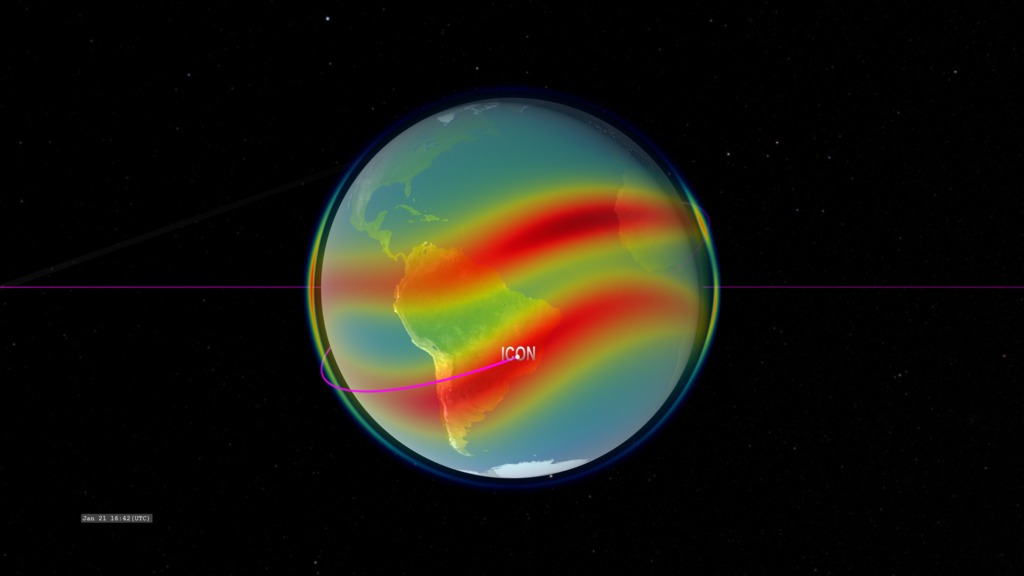
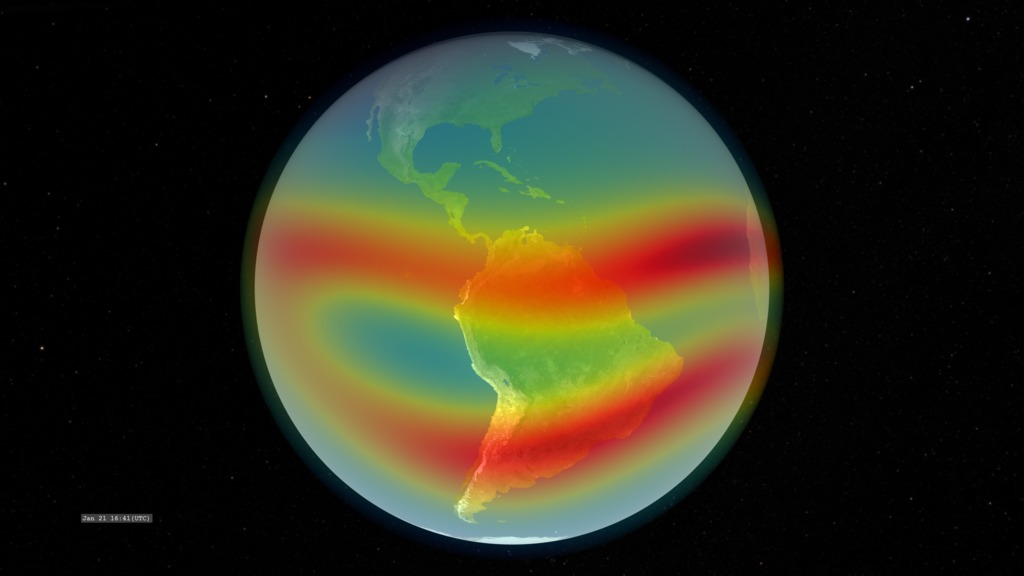
In this visualization, we present GOLD (in geostationary orbit around Earth) and ICON (in low Earth orbit). The colors over Earth represent model data from the IRI (International Reference Ionosphere) model of the density of the singly-ionized oxygen atom at an altitude of 350 kilometers. Red represents high density. The ion density is enhanced above and below the geomagnetic equator (not perfectly aligned with the geographic equator) on the dayside due to the ionizing effects of solar ultraviolet radiation combined with the effects of high-altitude winds and the geomagnetic field.
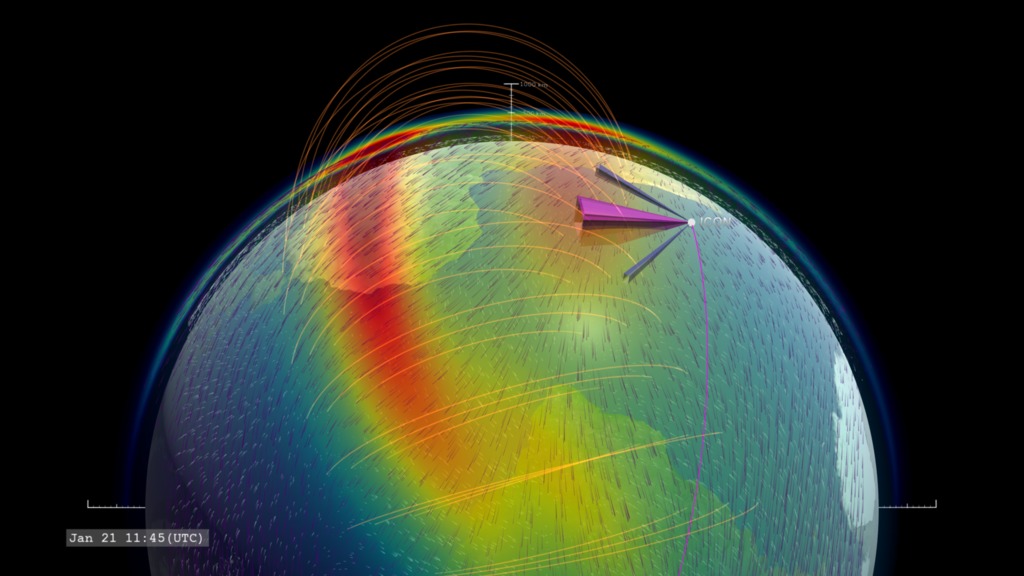
In the latter half of the visualization, the viewing fields of the various instruments are displayed. ICON has an EUV (Extreme Ultraviolet) and FUV (Far Ultraviolet) cameras (violet colored frustrums directed from spacecraft) pointing perpendicular to the orbit direction for detecting ionospheric emissions. Two Doppler interferometer cameras (blue) are directed at 45 degrees from this camera to detect ionospheric wind velocities.
GOLD has an imaging spectrometer (green) that periodically scans the disk of Earth with additional higher-resolution scans of the dayside limb.

Color bar of singly-ionized atomic oxygen density.
Visualization of ICON and GOLD orbiting Earth with image scanning. This version presents several geospace models, including the singly-ionized oxygen density and the high-altitude winds (100km and 350km altitudes).
Visualization of ICON and GOLD orbiting Earth with image scanning. This is an older version which is superceeded by the versions above.
Credits
Please give credit for this item to:
NASA's Scientific Visualization Studio
-
Visualizer
- Tom Bridgman (Global Science and Technology, Inc.)
-
Scientists
- Jeff Klenzing
- Sarah L. Jones (NASA/GSFC)
- Scott England (Space Sciences Laboratory, University of California at Berkeley)
-
Writer
- Sarah Frazier (ADNET Systems, Inc.)
-
Producer
- Genna Duberstein (USRA)
-
Technical support
- Laurence Schuler (ADNET Systems, Inc.)
- Ian Jones (ADNET Systems, Inc.)
Release date
This page was originally published on Wednesday, December 14, 2016.
This page was last updated on Tuesday, November 14, 2023 at 12:08 AM EST.
Missions
This visualization is related to the following missions:Series
This visualization can be found in the following series:Datasets used in this visualization
-
IGRF-2012 (International Geomagnetic Reference Field)
ID: 941 -
HWM 2014 (Horizontal Wind Model)
ID: 942 -
IRI 2016 (International Reference Ionosphere)
ID: 944
Note: While we identify the data sets used in these visualizations, we do not store any further details, nor the data sets themselves on our site.
Related
- ID: 4737
 Visualization
 - ID: 12825
 Infographic
 - ID: 4607
 Visualization
 - ID: 4594
 Visualization
 - ID: 4539
 Visualization
 - ID: 4498
 Visualization
 - ID: 4503
 Visualization
 - ID: 4504
 Visualization
Used as a Source In
- ID: 12823
 Produced Video
 - ID: 12817
![Complete transcript available.Music credits: 'Faint Glimmer' by Andrew John Skeet [PRS], Andrew Michael Britton [PRS], David Stephen Goldsmith [PRS], 'Ocean Spirals' by Andrew John Skeet [PRS], Andrew Michael Britton [PRS], David Stephen Goldsmith [PRS] from Killer Tracks.Watch this video on the NASA Goddard YouTube channel.](/vis/a010000/a012800/a012817/GOLDOverview_YouTube.00001_print.jpg) Produced Video
Produced Video