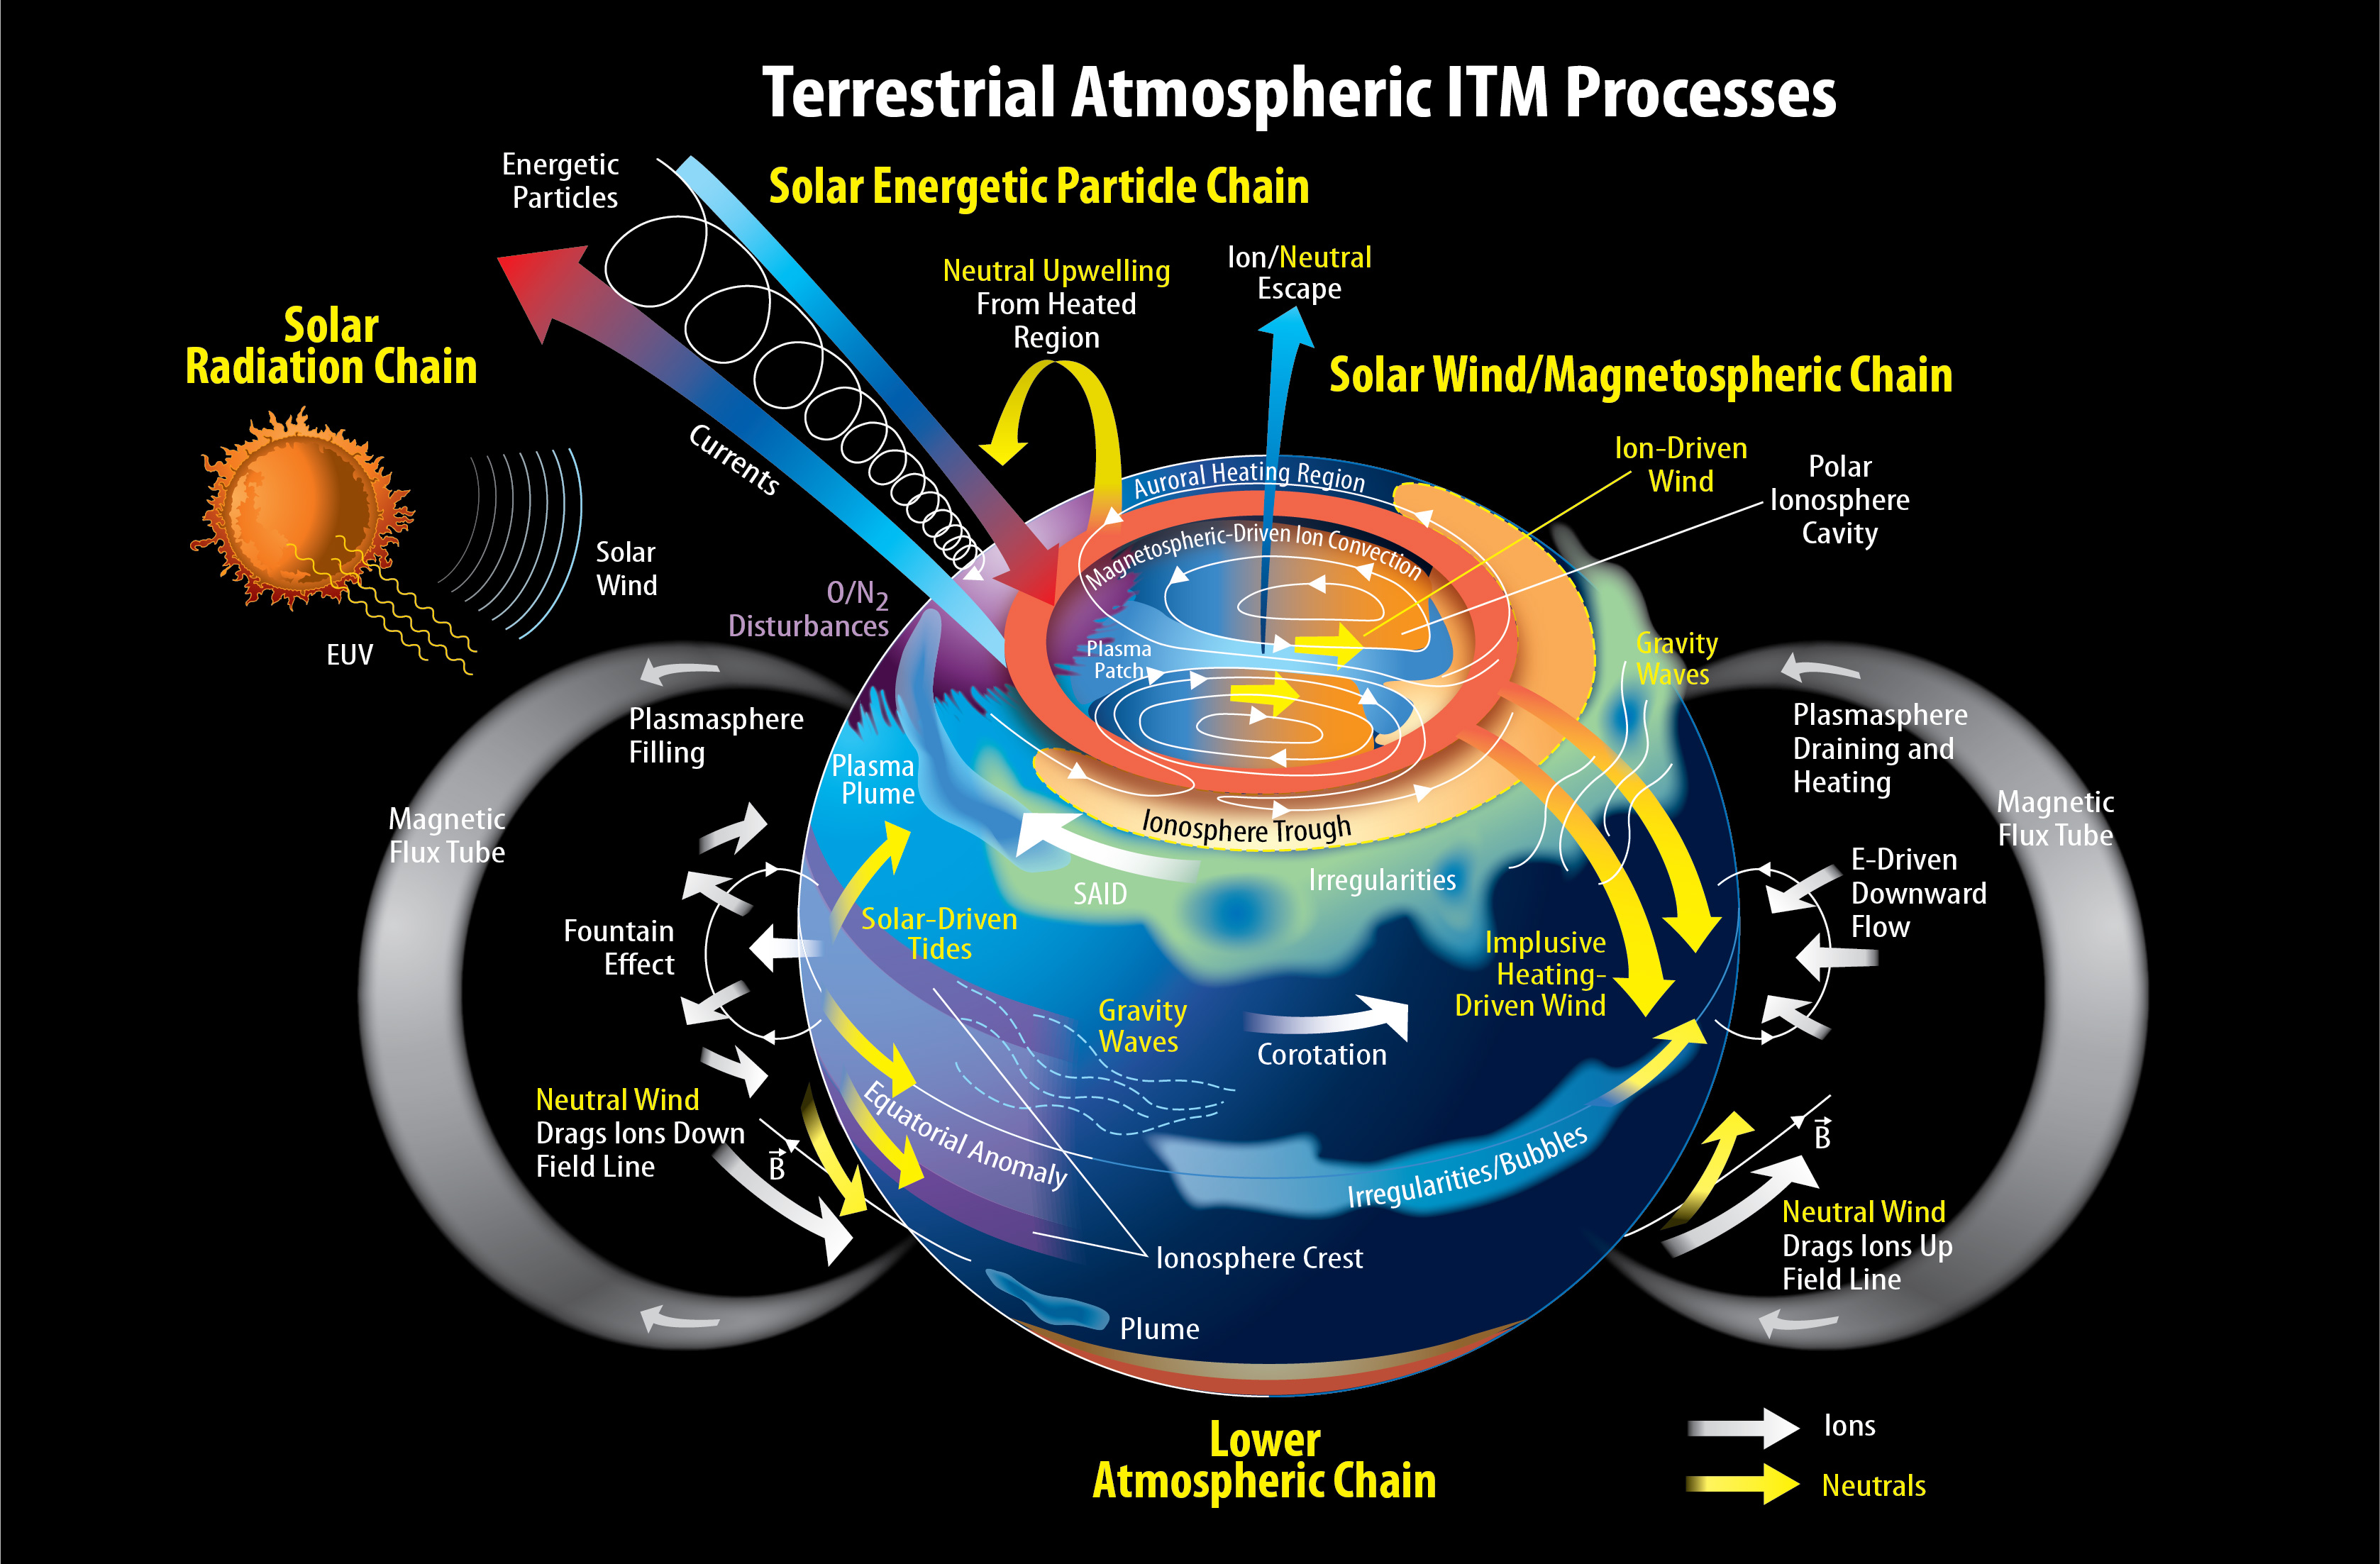
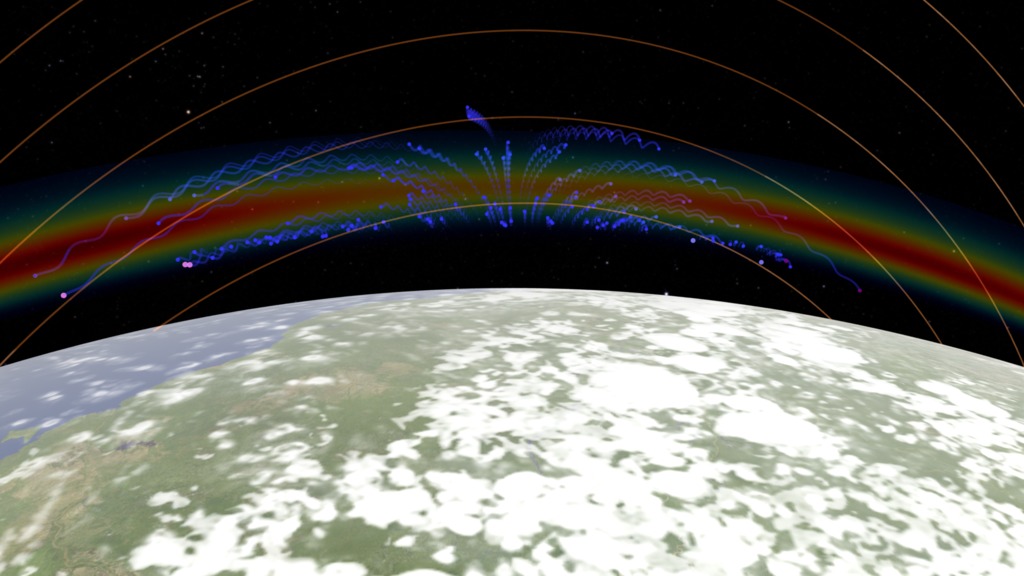
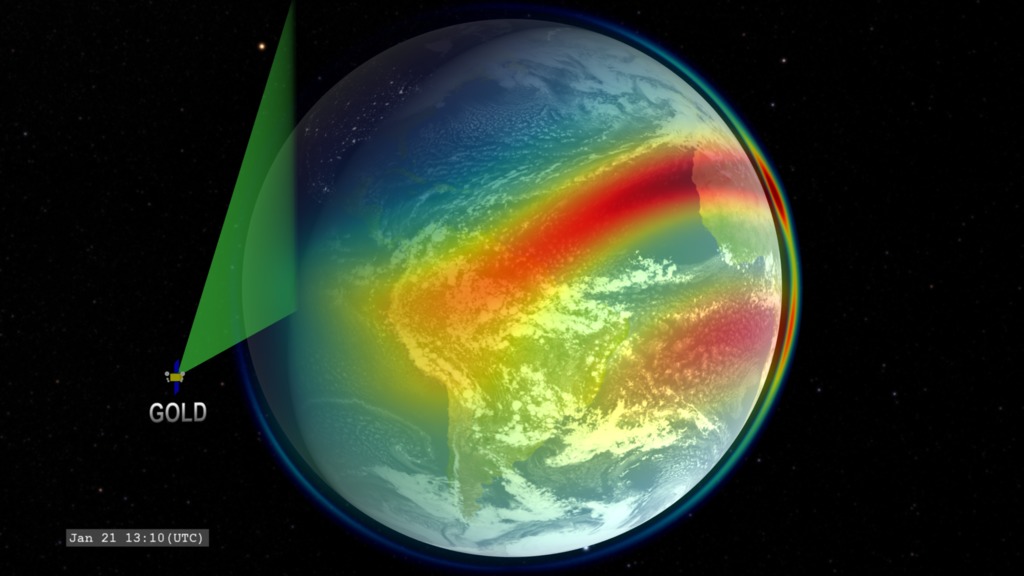
Exploring the Ionosphere: The Dayside Ionosphere
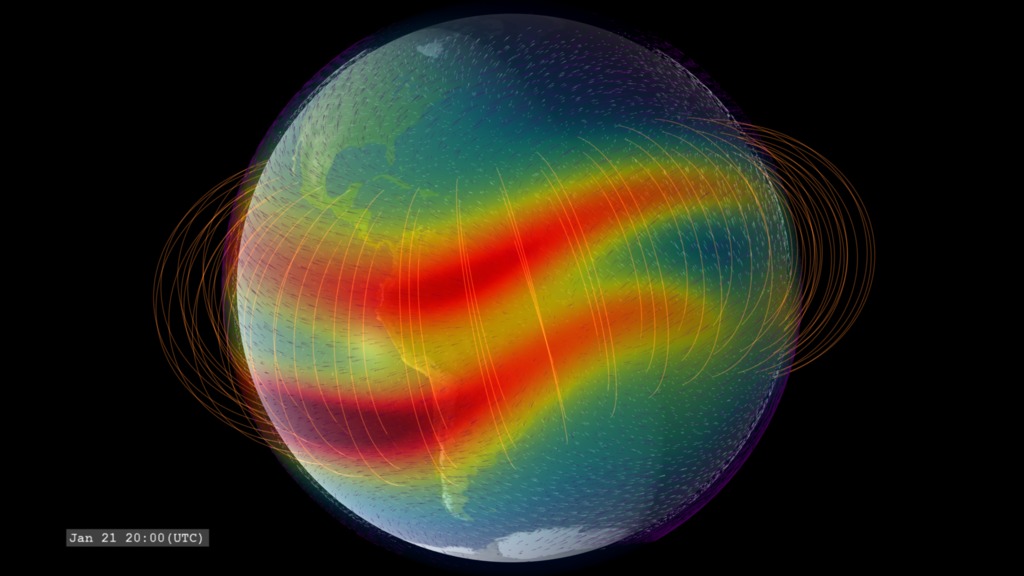
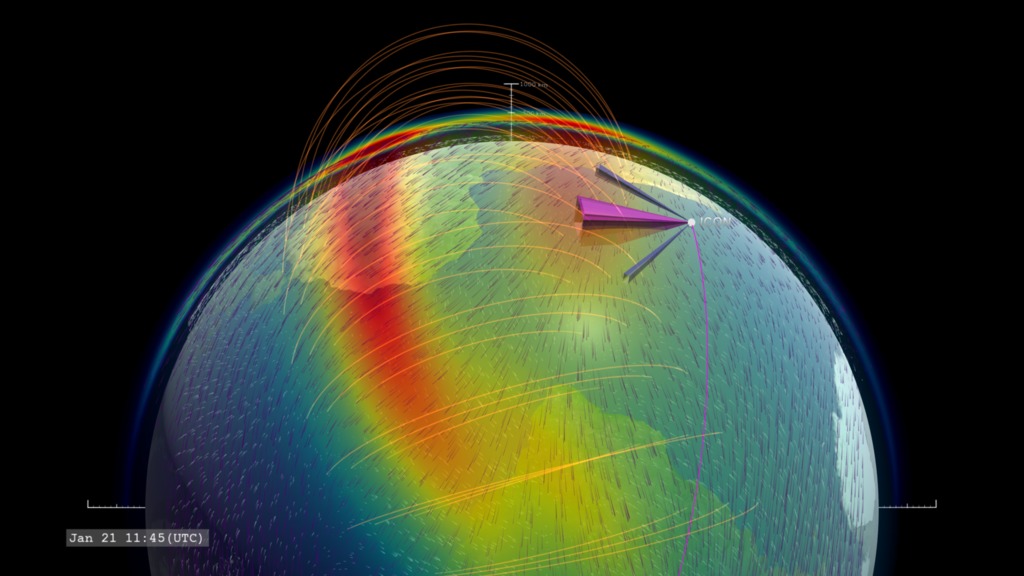
A view of the singly-ionizing oxygen atom on the dayside of Earth. This represents the variation of the enhancments due to variation in the geomagnetic field. This version interpolates the IRI model to a higher time cadence for a smoother animation.
The colors over Earth represent model data from the IRI (International Reference Ionosphere) model of the density of the singly-ionized oxygen atom at an altitude of 350 kilometers. Red represents high density. The ion density is enhanced above and below the geomagnetic equator (not perfectly aligned with the geographic equator) on the dayside due to the ionizing effects of solar ultraviolet radiation combined with the effects of high-altitude winds and the geomagnetic field. This ion density decreases at night as the ions recombine with free electrons.

Color bar of singly-ionized atomic oxygen density.
A view of the singly-ionizing oxygen atom on the dayside of Earth. This represents the variation of the enhancments due to variation in the geomagnetic field. In this version, the oxygen ion ionosphere model is sampled at 15 minute cadence which creates some 'jumping' in the ionosphere enhancements.
Credits
Please give credit for this item to:
NASA's Scientific Visualization Studio
-
Visualizer
- Tom Bridgman (Global Science and Technology, Inc.)
-
Scientists
- Jeff Klenzing
- Sarah L. Jones (NASA/GSFC)
-
Writer
- Sarah Frazier (ADNET Systems, Inc.)
-
Producer
- Genna Duberstein (USRA)
-
Technical support
- Laurence Schuler (ADNET Systems, Inc.)
- Ian Jones (ADNET Systems, Inc.)
Release date
This page was originally published on Thursday, October 27, 2016.
This page was last updated on Tuesday, November 14, 2023 at 12:08 AM EST.
Series
This visualization can be found in the following series:Datasets used in this visualization
-
IRI 2016 (International Reference Ionosphere)
ID: 944
Note: While we identify the data sets used in these visualizations, we do not store any further details, nor the data sets themselves on our site.
Related
- ID: 4641
- ID: 4617
 Visualization
 - ID: 12825
 Infographic
 - ID: 4610
 Visualization
 - ID: 12817
![Complete transcript available.Music credits: 'Faint Glimmer' by Andrew John Skeet [PRS], Andrew Michael Britton [PRS], David Stephen Goldsmith [PRS], 'Ocean Spirals' by Andrew John Skeet [PRS], Andrew Michael Britton [PRS], David Stephen Goldsmith [PRS] from Killer Tracks.Watch this video on the NASA Goddard YouTube channel.](/vis/a010000/a012800/a012817/GOLDOverview_YouTube.00001_print.jpg) Produced Video
Produced Video - ID: 4539
 Visualization
 - ID: 4527
 Visualization
 - ID: 4498
 Visualization
 - ID: 4503
 Visualization
Alternate Versions
- ID: 4594
 Visualization