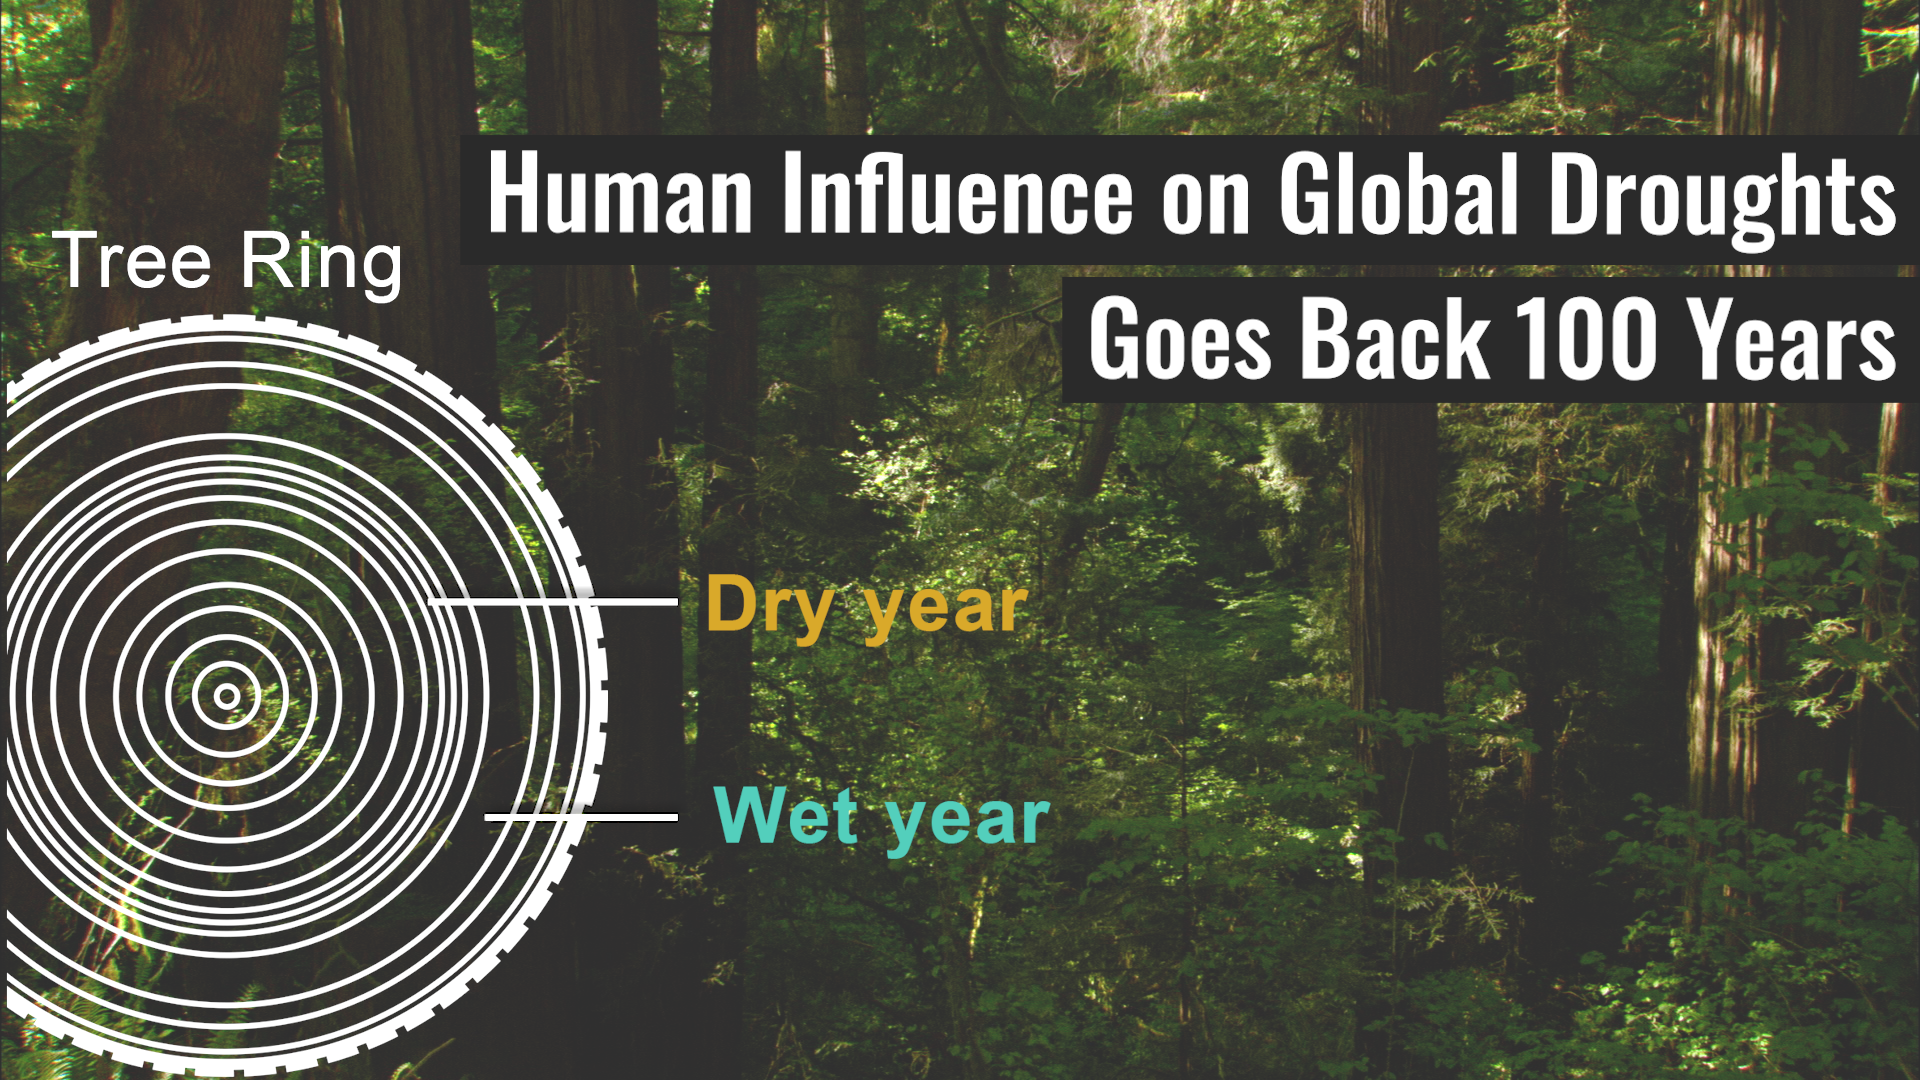
Using Tree Rings to Study Human Influence on Hydroclimate
This visualization displays a global drought atlas dating back to 1400, created using data from tree rings. The data is displayed on a flat rectangular map projection with a simple overlay depicting the differences in tree ring sizes for dry and wet years. In the second half of the visualization, a ‘fingerprint’ thumbnail is introduced, which is an indicator for human influences on climate change. A signal-to-noise ratio graph is depicted comparing the fingerprint to both tree ring drought atlas data and observational meteorological data (CRU and Dai)
Human-generated greenhouse gases and atmospheric particles were affecting global drought risk as far back as the early 20th century, according to a study from NASA’s Goddard Institute for Space Studies (GISS) in New York City.
The study compared real-world data with climate models, which predicted that human influences could be seen early in the 1900’s and would increase. To the researchers’ surprise, clear evidence of a human “fingerprint” — a global drought pattern more likely to occur if greenhouse gases are affecting the climate — emerged within the first half of the last century. While the study included various human and natural influences, the only one that consistently increased across the century and the globe was greenhouse gases, suggesting they drove the fingerprint.
The study is the first to provide historical evidence connecting human-generated emissions and drought, suggesting that forward-looking climate models are accurately predicting future drought conditions and that humans play a key role in their location and severity, the team said.
Global ‘drought atlas’ data derived from tree rings running from 1400-2005. Green is wetter and brown is dryer. No titles. Note that the timing of the frames slows during the years 1900-2005.

This graphic describes how thicker tree rings indicate a wet year, and thinner tree rings indicate dry years
“Fingerprint” still image depicting a global pattern of drought more likely to occur if greenhouse gasses are affecting the climate
This graph represents the signal-to-noise ratio of the fingerprint against tree ring drought atlas and observational meteorological data
“Fingerprint” still image depicting a global pattern of drought more likely to occur if greenhouse gasses are affecting the climate. This version has no labels
These are the corresponding dates for the Global ‘drought atlas’ visualization above
Credits
Please give credit for this item to:
NASA's Scientific Visualization Studio
-
Visualizer
- Kel Elkins (USRA)
-
Scientists
- Kate Marvel (NASA/GSFC GISS)
- Ben Cook (NASA/GSFC)
-
Writer
- Jessica Merzdorf (Telophase)
-
Producer
- LK Ward (USRA)
Release date
This page was originally published on Friday, December 14, 2018.
This page was last updated on Wednesday, November 15, 2023 at 12:09 AM EST.
Sources
- ID: 13198
 Produced Video
Used as a Source In
- ID: 13253
 Produced Video