Harvey Floods Texas and Threatens Louisiana (Final Tropical Storm Update)
GPM caught Tropical Storm Harvey twice on August 30th, 2017. This time the storm made landfall in Louisiana and moved up east of the Texas/Louisiana border pounding already drenched eastern Texas and western Louisiana with more rain.
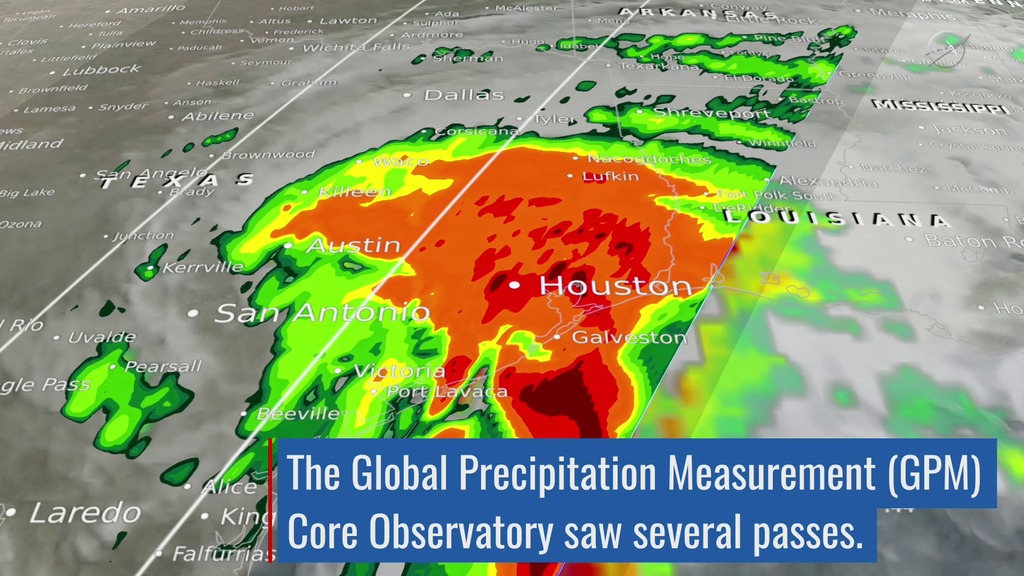
The Global Precipitation Mission (GPM) Core Observatory captured these images of Hurricane Harvey August 27th through the 30th, 2017.
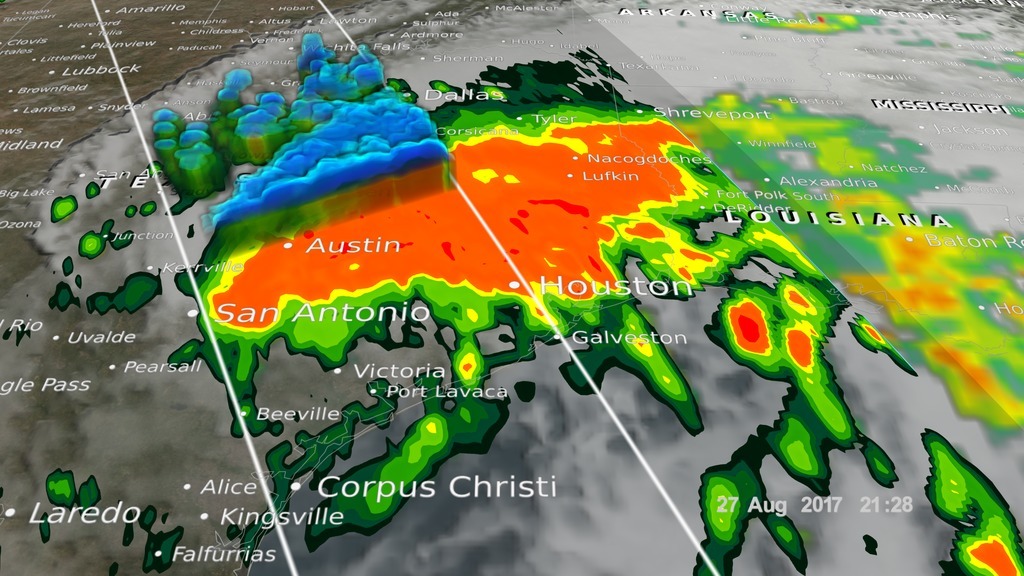
At 11:45 UTC and 21:25 UTC on the 27th of August nearly two days after the storm made landfall Harvey was meandering slowly southeast at just 2 mph (~4 kph) near Victoria, Texas west of Houston. The images at this stage show rain rates derived from GPM's GMI microwave imager (outer swath) and dual-frequency precipitation radar or DPR (inner swath) overlaid on enhanced infrared data from the GOES-East satellite as well as the IMERG precipitation product. Harvey's cyclonic circulation is still quite evident in the infrared clouds, but GPM shows that the rainfall pattern is highly asymmetric with the bulk of the rain located north or east of the center. A broad area of moderate rain can be seen stretching from near Galveston Bay to north of Houston and back well to the west. Within this are embedded areas of heavy rain (red areas); the peak estimated rain rate from GPM during these overpasses was 96 mm/hr (~3.77 inches per hour). With Harvey's circulation still reaching out over the Gulf, the storm is able to draw in a continuous supply of warm moist air to sustain the large amount of rain it is producing.
At 10:45 UTC and 20:25 UTC on August 28th Harvey's outer bands can be seen drenching the Louisana coastline, despite the fact that the main part of the storm still lingered over Houston, Texas.
Finally, on August 30th at 10:35 UTC Harvey can be seen shortly after making landfall a second time. Approximately 10 hours later Harvey can still be seen in nearly the same location continuing to dump heavy amounts of rain across the Texas/Louisiana border.
Tropical Storm Harvey through Monday, August 28. In addition to 4 GPM passes, this version also includes continuous IMERG rain rates throughout the life of the storm.
Hurricane Harvey on Sunday, August 27, 2017.

Color bar for liquid precipitation rates (ie, rain rates). Shades of green represent low amounts of liquid precipitation, whereas shades of red represent high amounts of precipitation.
Color bar for frozen precipitation rates (ie, snow rates). Shades of cyan represent low amounts of frozen precipitation, whereas shades of purple represent high amounts of precipitation.
Print resolution image of Harvey as it made landfall near Corpus Christi, Texas on August 26th at 1:32 UTC.
Print resolution image of Harvey as it drenched Houston, Texas and surrounding areas on August 27th, 2017 at 11:45 UTC.
Print resolution image of Harvey's precipitation structure being bisected by GPM's DPR instrument on August 27th, 2017 at 21:28 UTC.
Print resolution image of the entire precipitation structure that GPM's DPR image caught of Harvey over Houston, Texas and surrounding areas on August 27th, 2017 at 21:28 UTC.
Print resolution image of Harvey's precipitation structure over New Orleans, Louisiana. This image was taken shortly after Harvey made it's second landfall, this time hitting the Louisiana coastline on August 28th, 2017 at 10:51 UTC.
Print resolution image of Harvey as it lingered over the Texas and Louisana border on August 28th, 2017 at 20:35 UTC. It is interesting to note that Harvey's vast reach can easily be seen in this image, as it continued to rain on Houston, yet it's precipitation structure expands all the way out over eastern Louisiana.
Print resolution image of Harvey on August 30th, 2017 at 10:40 UTC as it stalled over the Texas and Louisiana border continuing to dump more rain.
Print resolution image of Harvey as a Tropical Storm still lingering over the Texas and Louisiana border on August 30th, 2017 at 20:24 UTC.
Credits
Please give credit for this item to:
NASA's Scientific Visualization Studio. GPM data provided by the joint NASA/JAXA GPM mission.
-
Data visualizers
- Alex Kekesi (Global Science and Technology, Inc.)
- Horace Mitchell (NASA/GSFC)
- Ernie Wright (USRA)
-
Producer
- Ryan Fitzgibbons (USRA)
-
Scientists
- Gail Skofronick Jackson (NASA/GSFC)
- George Huffman (NASA/GSFC)
- Dalia B Kirschbaum (NASA/GSFC)
-
Technical support
- Laurence Schuler (ADNET Systems, Inc.)
- Ian Jones (ADNET Systems, Inc.)
Release date
This page was originally published on Thursday, August 31, 2017.
This page was last updated on Wednesday, November 15, 2023 at 12:09 AM EST.
Missions
This visualization is related to the following missions:Series
This visualization can be found in the following series:Datasets used in this visualization
-
[GOES: IR4]
ID: 33 -
Rain Rates (Surface Precipitation) [GPM: GMI]
ID: 822Credit: Data provided by the joint NASA/JAXA GPM mission.
See all pages that use this dataset -
Volumetric Precipitation data (Ku) [GPM: DPR]
ID: 830Credit: Data provided by the joint NASA/JAXA GPM mission.
See all pages that use this dataset -
IMERG
ID: 863This dataset can be found at: http://pmm.nasa.gov/sites/default/files/document_files/IMERG_ATBD_V4.4.pdf
See all pages that use this dataset
Note: While we identify the data sets used in these visualizations, we do not store any further details, nor the data sets themselves on our site.
Used as a Source In
- ID: 12738
![Watch this video on the NASA Goddard YouTube channel.Complete transcript available.Music credits: 'Micro Currents' by Jean-Patrick Voindrot [SACEM], 'Sink Deep' by Andrew Michael Britton [PRS], David Stephen Goldsmith [PRS], Mikey Rowe [PRS] from Killer Tracks.](/vis/a010000/a012700/a012738/LARGE_MP4-12738_RapidIntensification_large.00084_print.jpg) Produced Video
Produced Video - ID: 12701
 Produced Video
 - ID: 12697
 Produced Video