A newer version of this visualization is available.
Five-Year Global Temperature Anomalies from 1880 to 2015
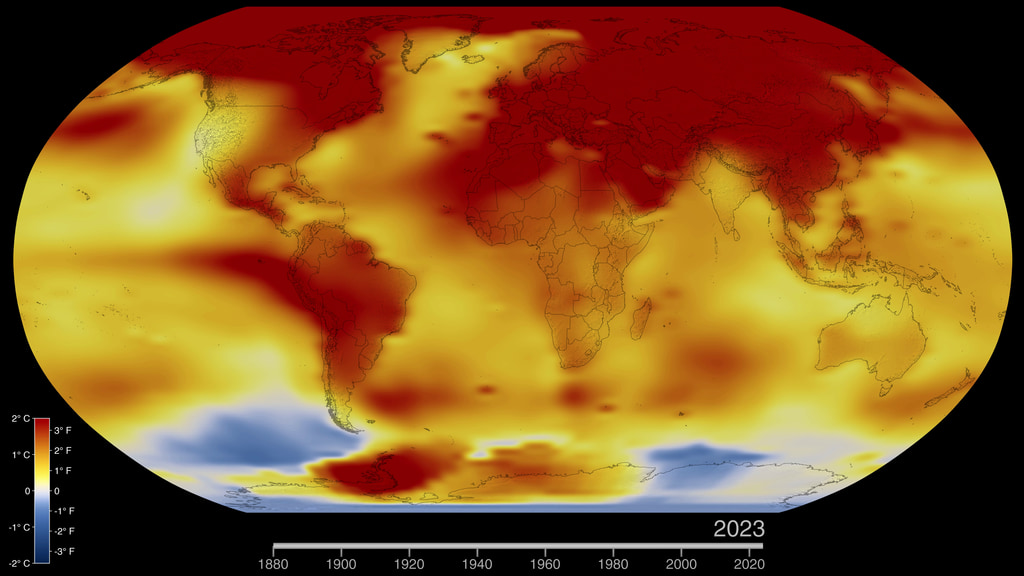
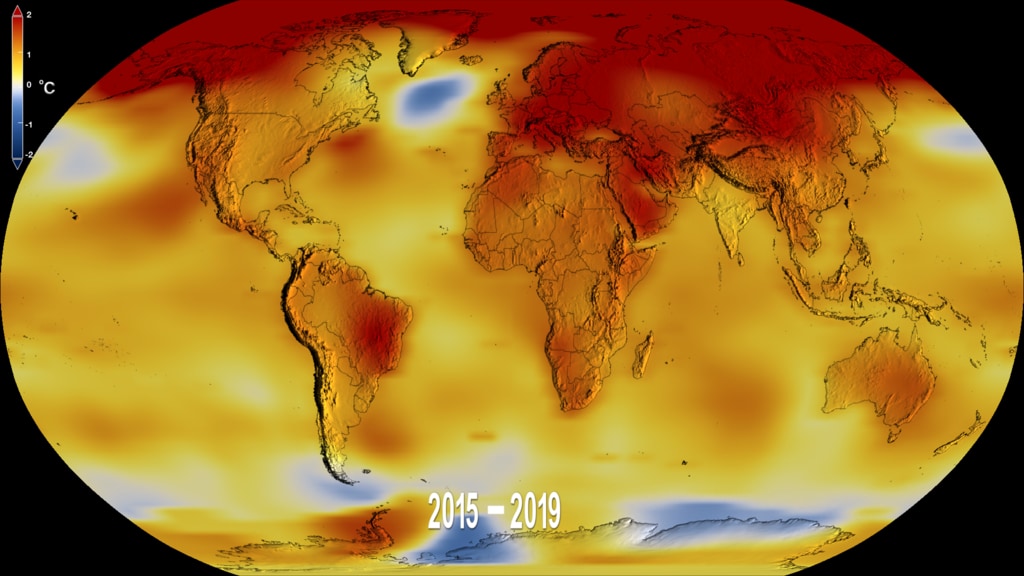
This color-coded map in Robinson projection displays a progression of changing global surface temperature anomalies from 1880 through 2015. Higher than normal temperatures are shown in red and lower then normal termperatures are shown in blue. The final frame represents the global temperatures 5-year averaged from 2011 through 2015. Scale in degree Celsius.
This video is also available on our YouTube channel.
Earth’s 2015 surface temperatures were the warmest since modern record keeping began in 1880, according to independent analyses by NASA and the National Oceanic and Atmospheric Administration (NOAA).
Globally-averaged temperatures in 2015 shattered the previous mark set in 2014 by 0.23 degrees Fahrenheit (0.13 Celsius). Only once before, in 1998, has the new record been greater than the old record by this much.
The 2015 temperatures continue a long-term warming trend, according to analyses by scientists at NASA’s Goddard Institute for Space Studies (GISS) in New York (GISTEMP). NOAA scientists agreed with the finding that 2015 was the warmest year on record based on separate, independent analyses of the data. Because weather station locations and measurements change over time, there is some uncertainty in the individual values in the GISTEMP index. Taking this into account, NASA analysis estimates 2015 was the warmest year with 94 percent certainty.
“Climate change is the challenge of our generation, and NASA’s vital work on this important issue affects every person on Earth,” said NASA Administrator Charles Bolden. “Today’s announcement not only underscores how critical NASA’s Earth observation program is, it is a key data point that should make policy makers stand up and take notice - now is the time to act on climate.”
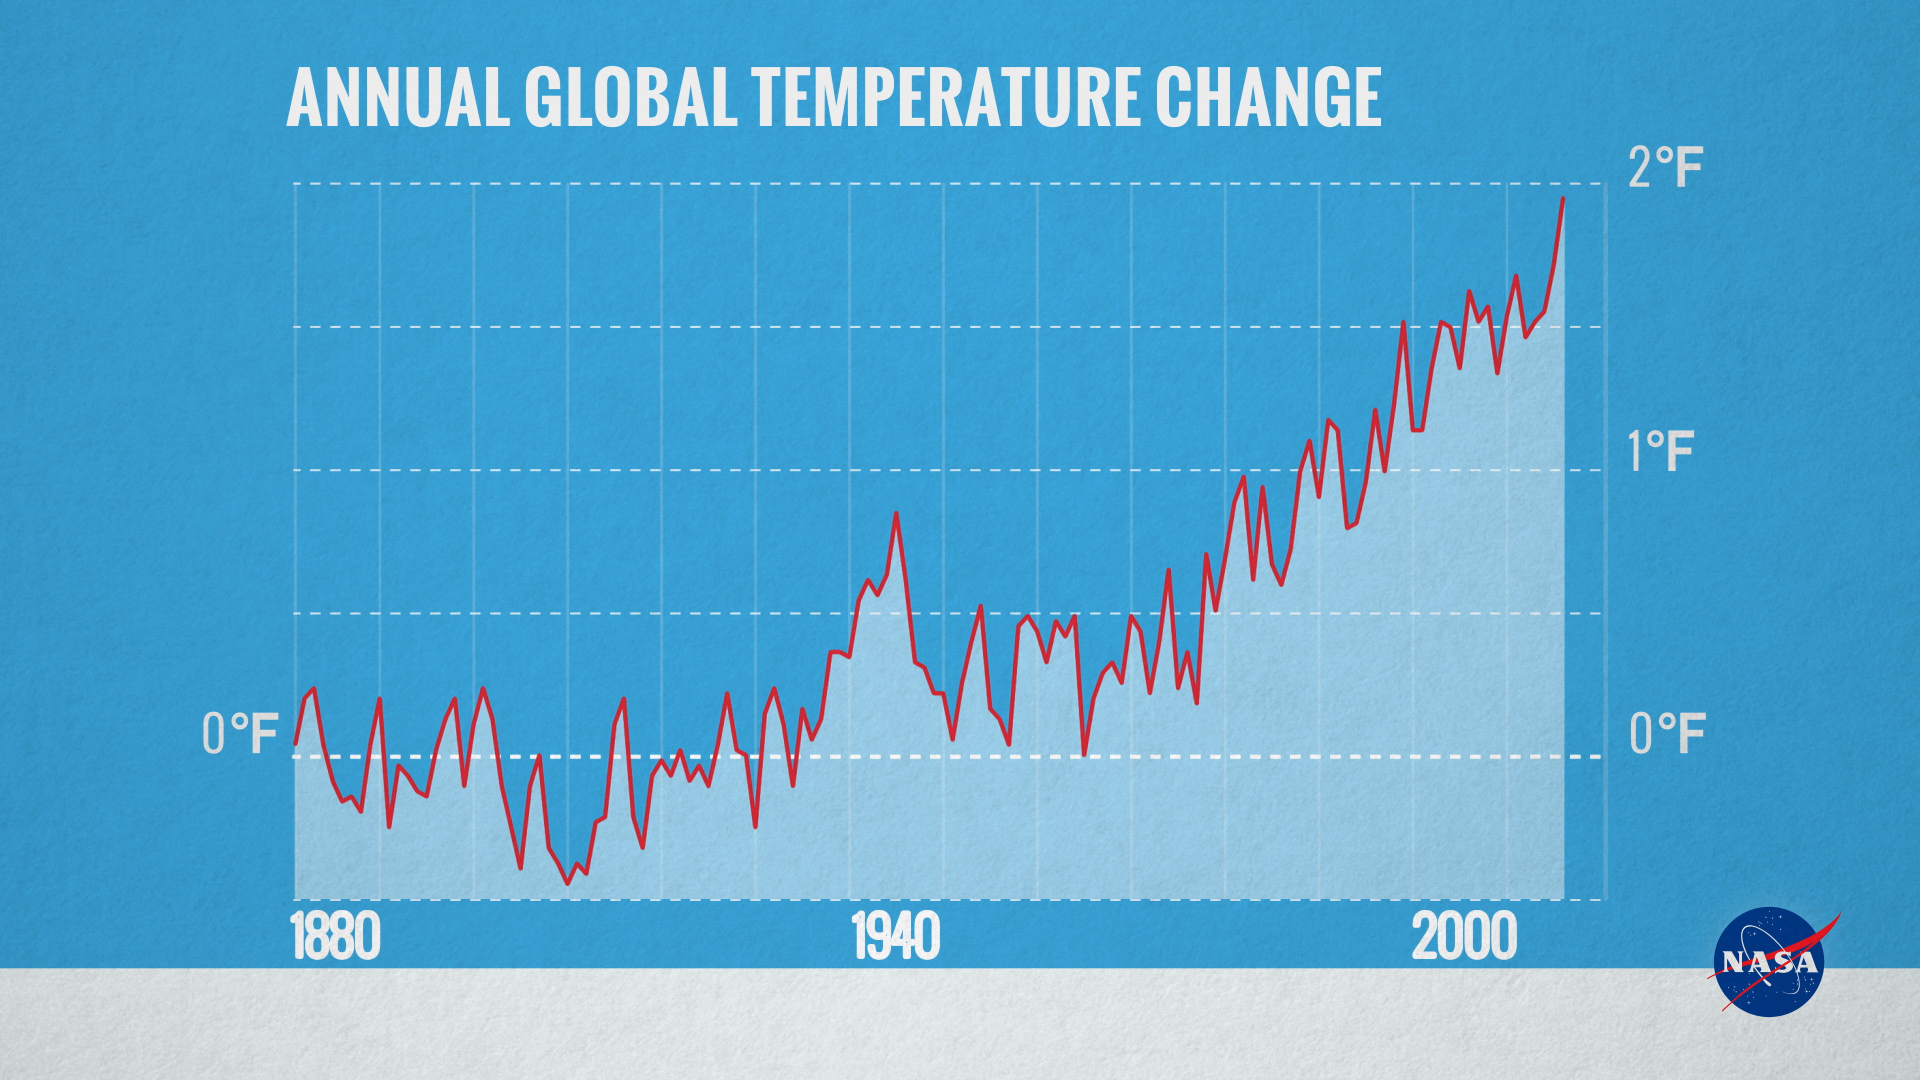
The planet’s average surface temperature has risen about 1.8 degrees Fahrenheit (1.0 degree Celsius) since the late-19th century, a change largely driven by increased carbon dioxide and other human-made emissions into the atmosphere.
Most of the warming occurred in the past 35 years, with 15 of the 16 warmest years on record occurring since 2001. Last year was the first time the global average temperatures were 1 degree Celsius or more above the 1880-1899 average.
Phenomena such as El Niño or La Niña, which warm or cool the tropical Pacific Ocean, can contribute to short-term variations in global average temperature. A warming El Niño was in effect for most of 2015.
“2015 was remarkable even in the context of the ongoing El Niño,” said GISS Director Gavin Schmidt. “Last year’s temperatures had an assist from El Niño, but it is the cumulative effect of the long-term trend that has resulted in the record warming that we are seeing.”
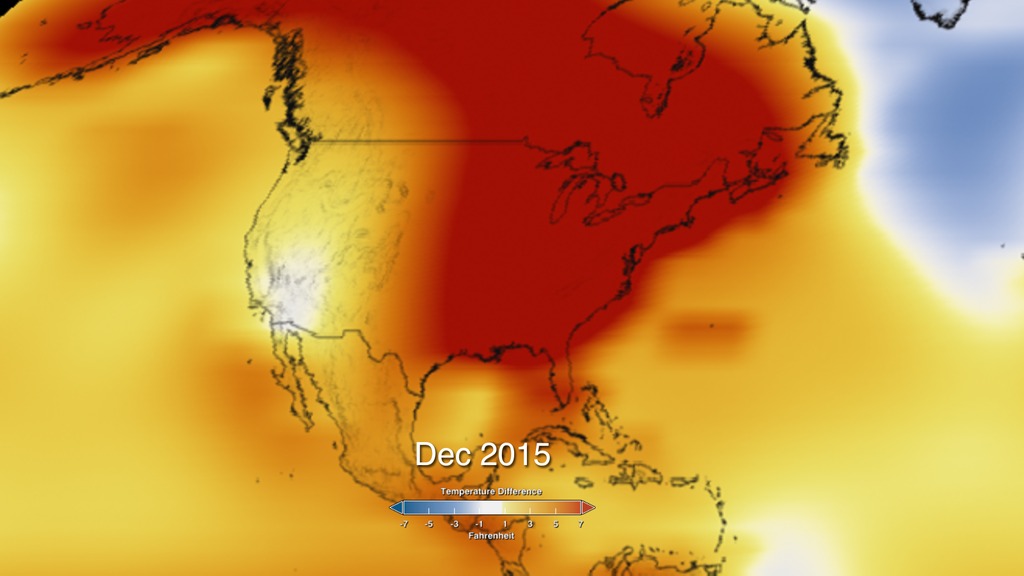
Weather dynamics often affect regional temperatures, so not every region on Earth experienced record average temperatures last year. For example, NASA and NOAA found that the 2015 annual mean temperature for the contiguous 48 United States was the second warmest on record.
The GISTEMP analysis website is located at: http://data.giss.nasa.gov/gistemp/
This color-coded map draped over the spherical Earth displays a progression of changing global surface temperature anomalies from 1880 through 2015. Higher than normal temperatures are shown in red and lower then normal termperatures are shown in blue. The final frame represents the global temperatures 5-year averaged from 2011 through 2015. Scale is in degrees Celsius.
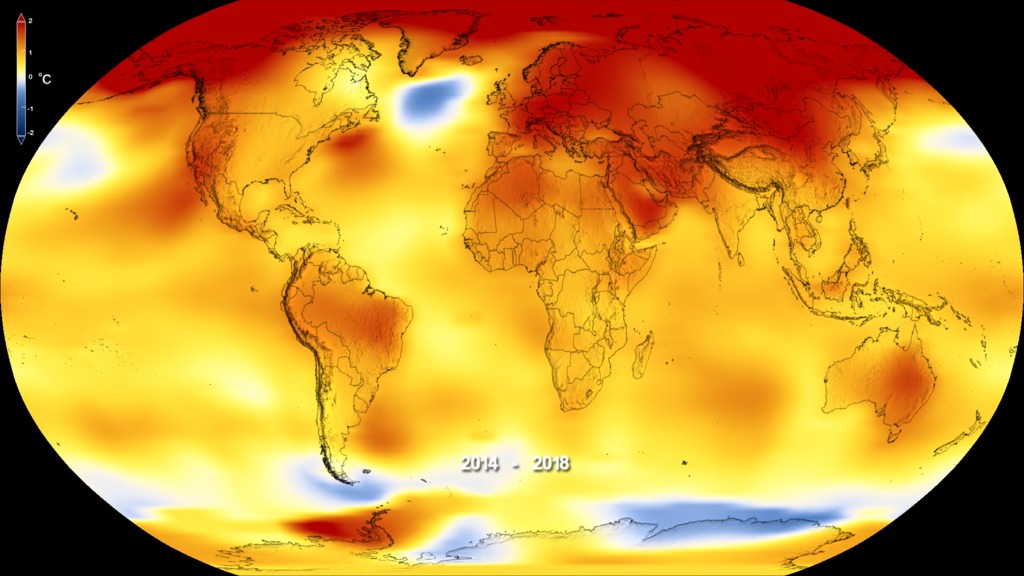
This color-coded map in Robinson projection displays a progression of changing global surface temperature anomalies from 1880 through 2014. Higher than normal temperatures are shown in red and lower then normal termperatures are shown in blue. The final frame represents the global temperatures 5-year averaged from 2010 through 2014. Scale in degrees Fahrenheit.

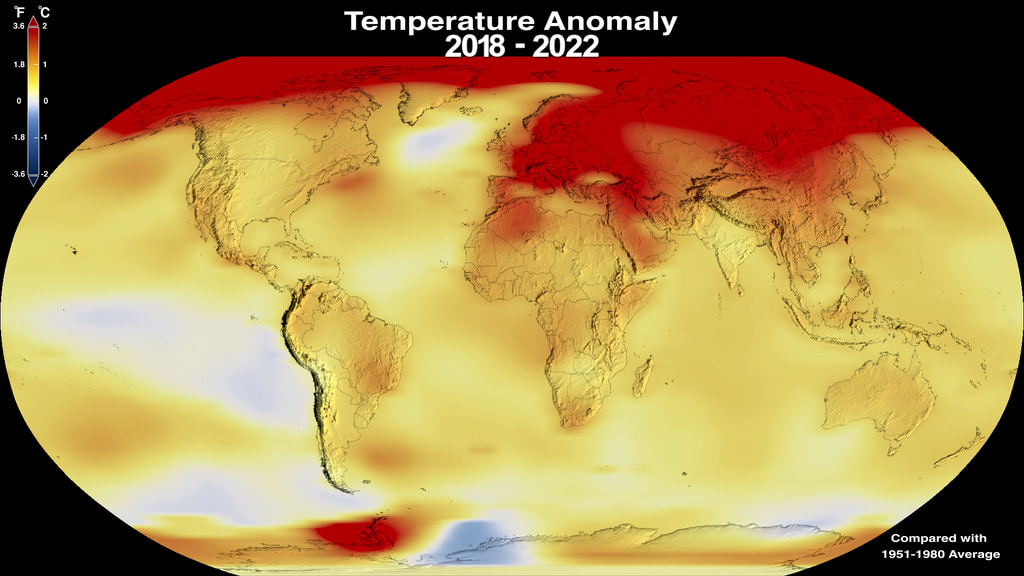
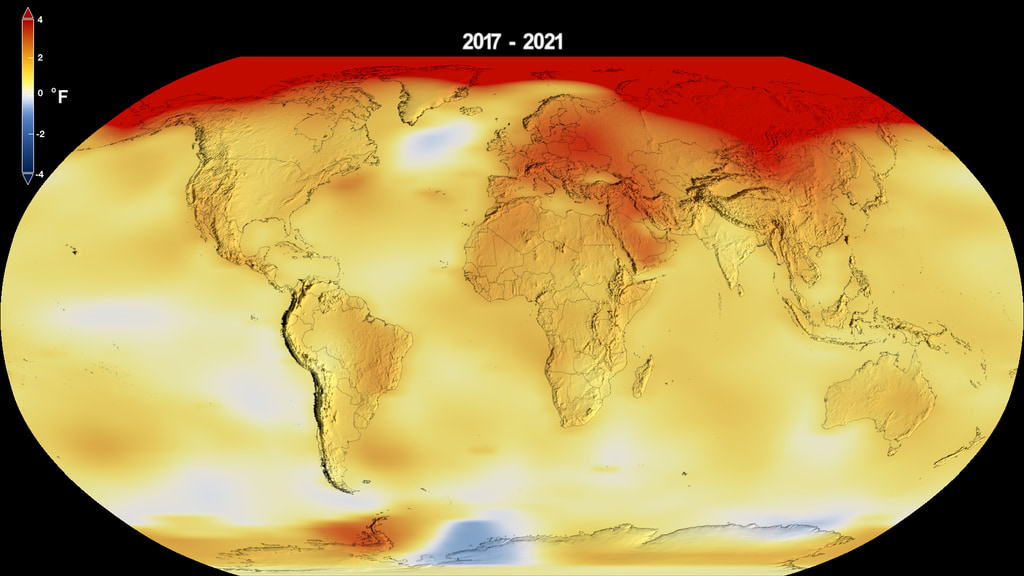
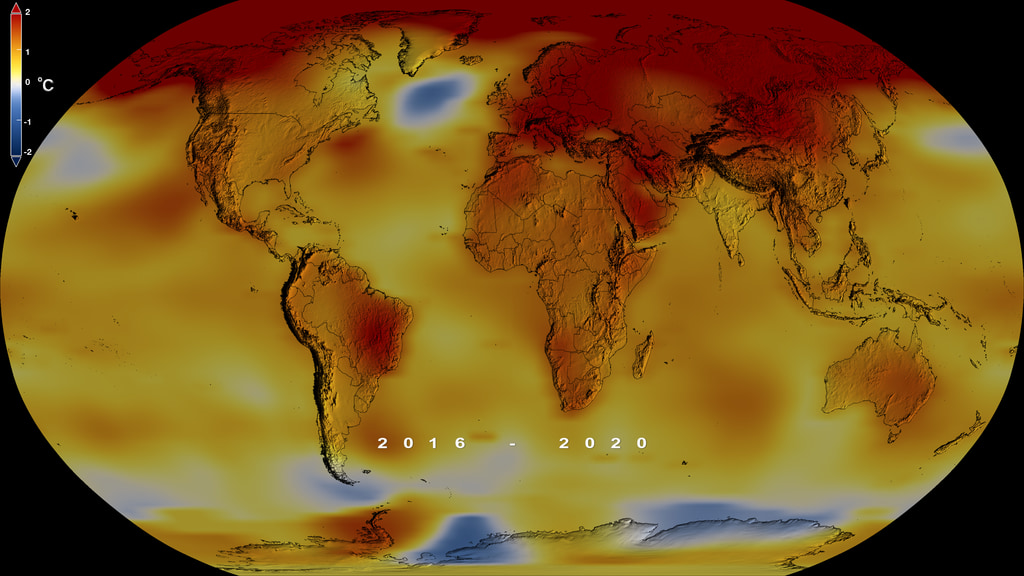
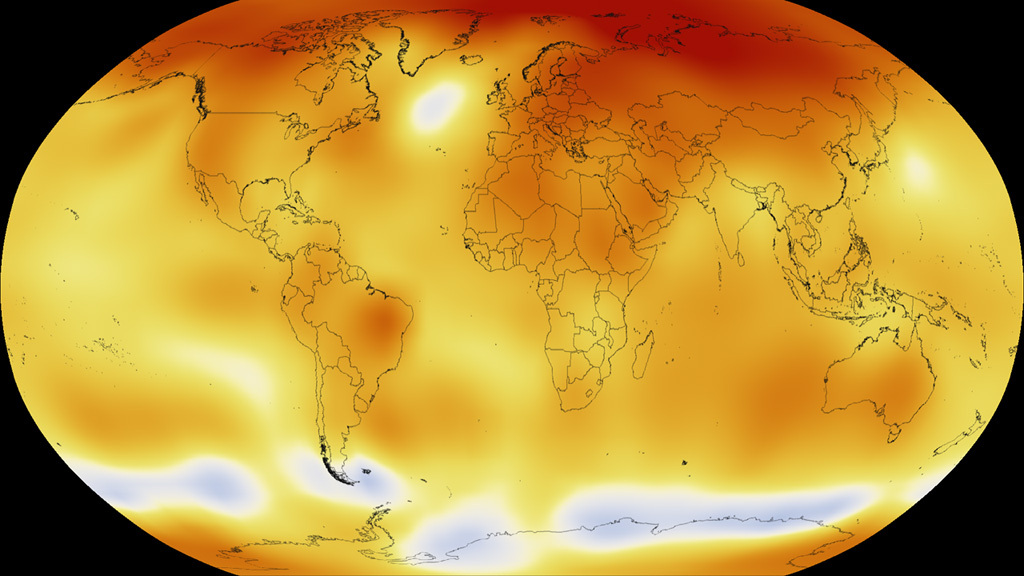
This frame sequence of color-coded global temperature anomalies in robinson projection display a progression of changing global surface temperatures. Each image represents a unique 5 year rolling time period with no fades between datasets. Higher than normal temperatures are shown in red and lower than normal are shown in blue.

Colortable in fahrenheit from -4 degrees to +4 degrees
This is an abbreviated version because this movie only uses the frames from 1950 through 2015.

Global temperature anomalies averaged from 1881-1885 using the colortable in fahrenheit.
Global temperature anomalies averaged from 1891-1895 using the colortable in fahrenheit.
Global temperature anomalies averaged from 1901-1905 using the colortable in fahrenheit.
Global temperature anomalies averaged from 1911-1915 using the colortable in fahrenheit.
Global temperature anomalies averaged from 1921-1925 using the colortable in fahrenheit.
Global temperature anomalies averaged from 1931-1935 using the colortable in fahrenheit.
Global temperature anomalies averaged from 1941-1945 using the colortable in fahrenheit.
Global temperature anomalies averaged from 1951-1955 using the colortable in fahrenheit.
Global temperature anomalies averaged from 1961-1965 using the colortable in fahrenheit.
Global temperature anomalies averaged from 1971-1975 using the colortable in fahrenheit.
Global temperature anomalies averaged from 1981-1985 using the colortable in fahrenheit.
Global temperature anomalies averaged from 1991-1995 using the colortable in fahrenheit.
Global temperature anomalies averaged from 2001-2005 using the colortable in fahrenheit.
Global temperature anomalies averaged from 2011-2015 using the colortable in fahrenheit.
Credits
Please give credit for this item to:
NASA/Goddard Space Flight Center Scientific Visualization Studio
Data provided by Robert B. Schmunk (NASA/GSFC GISS)
-
Data visualizer
- Lori Perkins (NASA/GSFC)
-
Scientists
- Gavin A. Schmidt (NASA/GSFC GISS)
- Robert B Schmunk (SIGMA Space Partners, LLC.)
- Reto A. Ruedy (SIGMA Space Partners, LLC.)
-
Writer
- Patrick Lynch (Wyle Information Systems)
-
Producers
- Michelle Handleman (USRA)
- Leslie McCarthy
- Matthew R. Radcliff (USRA)
Release date
This page was originally published on Wednesday, January 20, 2016.
This page was last updated on Sunday, January 5, 2025 at 12:07 AM EST.
Series
This page can be found in the following series:Datasets used
-
GISTEMP [GISS Surface Temperature Analysis (GISTEMP)]
ID: 585The GISS Surface Temperature Analysis version 4 (GISTEMP v4) is an estimate of global surface temperature change. Graphs and tables are updated around the middle of every month using current data files from NOAA GHCN v4 (meteorological stations) and ERSST v5 (ocean areas), combined as described in our publications Hansen et al. (2010), Lenssen et al. (2019), and Lenssen et al. (2024).
Credit: Lenssen, N., G.A. Schmidt, M. Hendrickson, P. Jacobs, M. Menne, and R. Ruedy, 2024: A GISTEMPv4 observational uncertainty ensemble. J. Geophys. Res. Atmos., 129, no. 17, e2023JD040179, doi:10.1029/2023JD040179.
This dataset can be found at: https://data.giss.nasa.gov/gistemp/
See all pages that use this dataset
Note: While we identify the data sets used on this page, we do not store any further details, nor the data sets themselves on our site.
Related
- ID: 12152
 Produced Video
 - ID: 12134
 Produced Video
 - ID: 4420
 Visualization
 - ID: 12133
 Produced Video
 - ID: 12122
 Produced Video
Newer Versions
- ID: 5207
 Visualization
 - ID: 5060
 Visualization
 - ID: 4964
 Visualization
 - ID: 4882
 Visualization
 - ID: 4787
 Visualization
 - ID: 4626
 Visualization
Used as a Source In
- ID: 12139
 Produced Video