A Quarter Century US Forest Disturbance History from Landsat – the NAFD-NEX Products
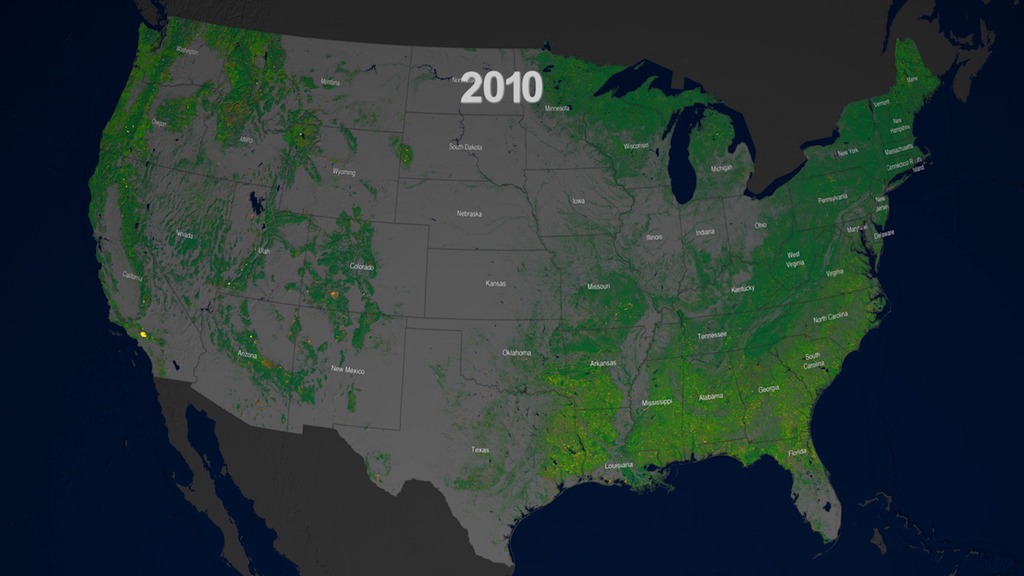
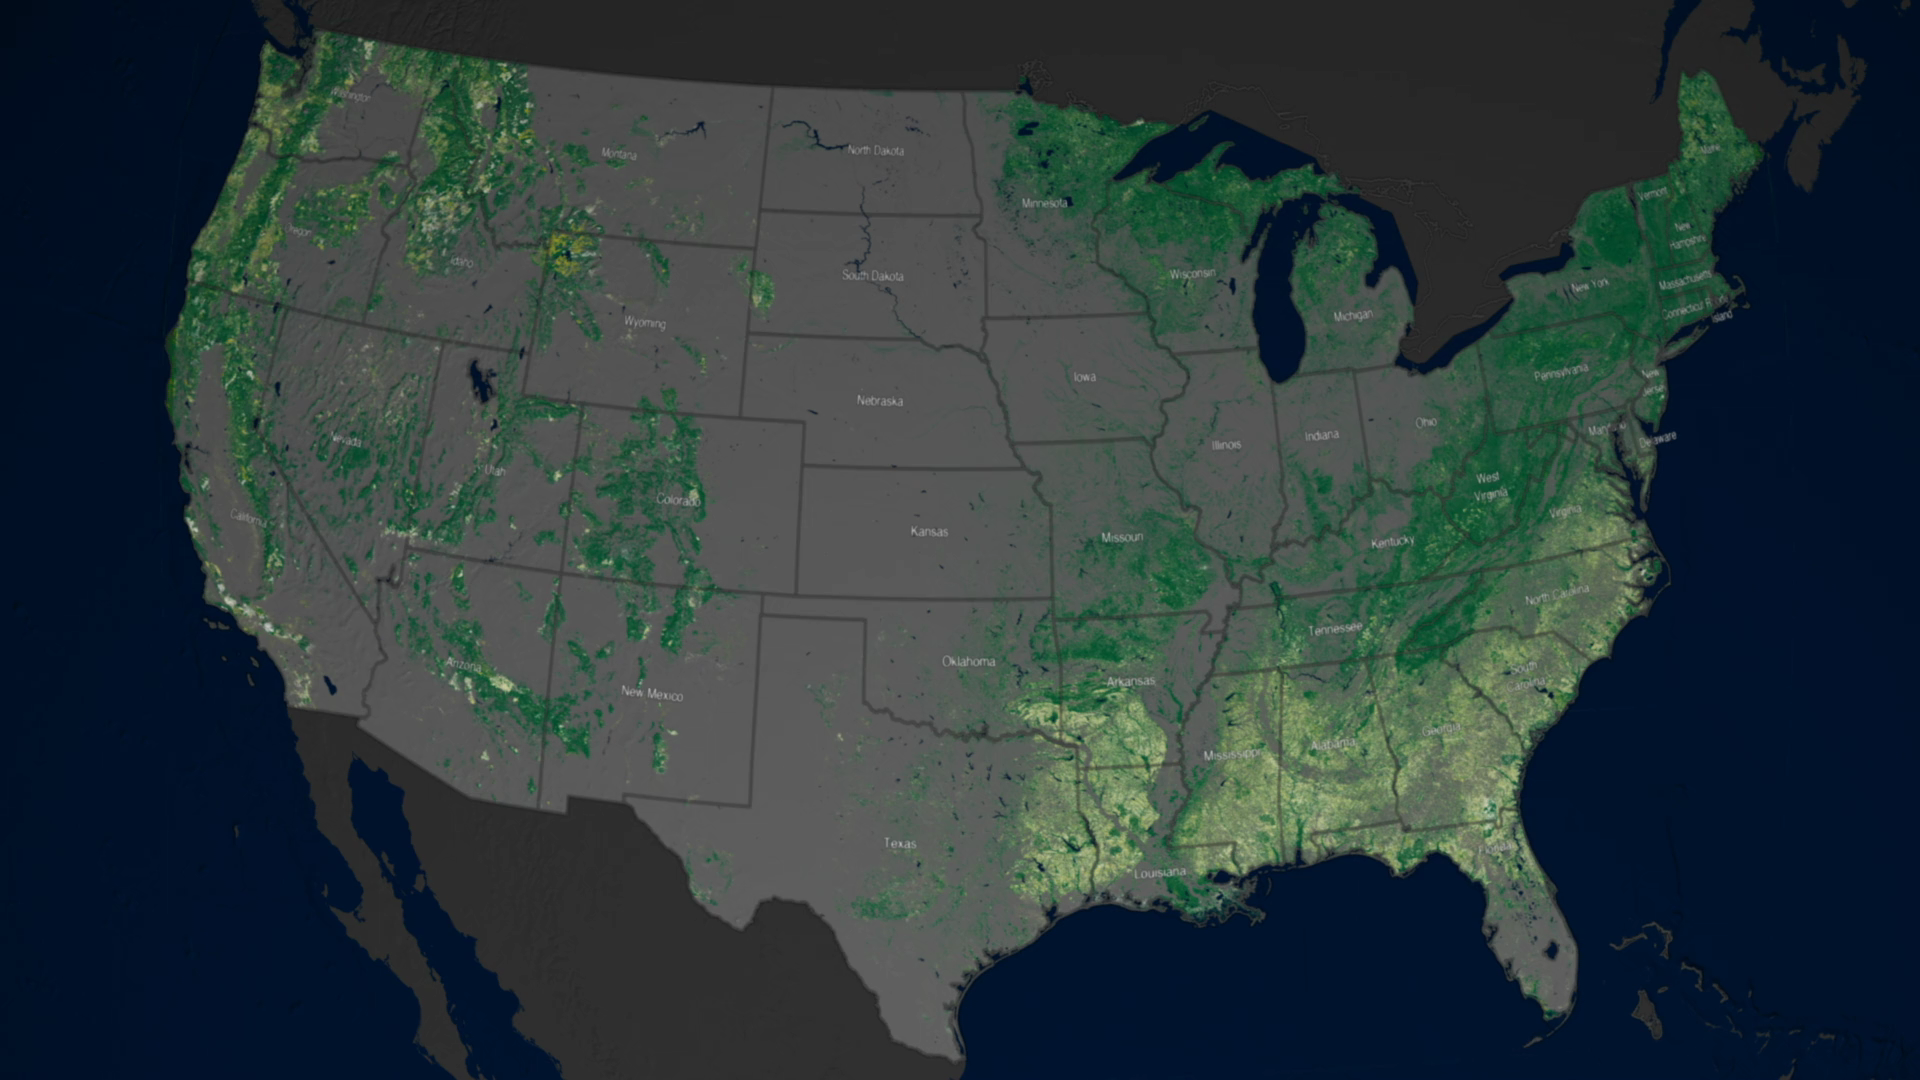
Visualization showing forest change in various locations from 1986 to 2010
This video is also available on our YouTube channel.
The North American Forest Dynamics (NAFD) study provides annual maps of forest disturbance in the conterminous United States, from 1986-2010. Using data from the NASA/USGS Landsat satellite program, the NAFD study produces maps at a spatial resolution of 30-meters. Spanning the 25 years of the study required 26,142 Landsat images and the use of the NASA Earth Exchange (NEX) supercomputing facility. Each annual map has classified pixels showing water, no forest cover, forest cover, no data available (data gaps) in present year, and forest disturbances that occurred in that year.
Forest disturbance, in this study, refers to any removal or loss of the forest canopy. There were disturbances from natural causes, such as fires, insect outbreaks, hurricanes, tornadoes, and snow storms. There were also human-caused disturbances such as timber harvesting, urban development, and mining. Major timber harvest areas included the Southeast, the Pacific Northwest, and Maine. Extensive mountaintop mining was found in the Southern Appalachians, extending from Western Virginia to Tennessee. The eastern coast suffered substantial damages from hurricanes, while large scale damages from fire and insect outbreak were mostly in the western U.S.
This study is a core project of the North American Carbon Program (NACP), a multidisciplinary research program designed to obtain scientific understanding of North America’s carbon sources and sinks and quantify changes in carbon stocks. This information is being used to evaluate the role of forest disturbance in the North American carbon cycle, which will help meet societal concerns and provide tools for decision makers.
The NAFD (North American Forest Dynamics) study, a core project of the North American Carbon Program (NACP), was supported by grants from NASA’s Terrestrial Ecology, Carbon Cycle Sciences, and Applied Sciences Programs. The UMD group was supported under NASA Grant NNX11AJ78G S01. Associated NAFD-NEX activities have been carried out by Warren Cohen, USFS Pacific Northwest Research Station (Product Validation), Jeffrey Masek, NASA Goddard Space Flight Center (Regrowth Dynamics), Gretchen Moisen, USFS Rocky Mountain Research Station (Causal Factors Attribution) and Ramakrishna Nemani, NASA Ames Research Center (NEX computing).
Data Citation:
Goward, S.N., C. Huang, F. Zhao, K. Schleeweis, K. Rishmawi, M. Lindsey, J.L. Dungan, and A. Michaelis. 2015. NACP NAFD Project: Forest Disturbance History from Landsat, 1986-2010. ORNL DAAC, Oak Ridge, Tennessee, USA. http://dx.doi.org/10.3334/ORNLDAAC/1290

Colors for persistent water (dark blue), nonforest (gray), and forest (dark green)

Colors for the integrated forest disturbance (beginning of the visualization) from 1986 (yellowish-green) through 2010 (white)

Colors for disturbed forest (orange) through recovery (green)
Credits
Please give credit for this item to:
NASA's Scientific Visualization Studio
-
Visualizer
- Greg Shirah (NASA/GSFC)
-
Producer
- Matthew R. Radcliff (USRA)
-
Scientists
- Jeffrey Masek (NASA/GSFC)
- Chengquan Huang (University of Maryland)
- Feng Zhao (University of Maryland)
Release date
This page was originally published on Monday, November 30, 2015.
This page was last updated on Tuesday, November 14, 2023 at 12:07 AM EST.
Missions
This visualization is related to the following missions:Series
This visualization can be found in the following series:Datasets used in this visualization
-
NAFD (North American Forest Dynamics) [Landsat]
ID: 933The North American Forest Dynamics (NAFD) study provides annual maps of forest disturbance in the conterminous United States, from 1986-2010. Using data from the NASA/USGS Landsat satellite program, the NAFD study produces maps at a spatial resolution of 30-meters. Spanning the 25 years of the study required 26,142 Landsat images and the use of the NASA Earth
See all pages that use this dataset
Note: While we identify the data sets used in these visualizations, we do not store any further details, nor the data sets themselves on our site.
Related
- ID: 12051
 Produced Video
Used as a Source In
- ID: 12419
 Produced Video