Q&A with RaD-X Project Scientist, Erica Alston
This gallery was created for Earth Science Week 2015 and beyond. It includes a quick start guide for educators and first-hand stories (blogs) for learners of all ages by NASA visualizers, scientists and educators. We hope that your understanding and use of NASA's visualizations will only increase as your appreciation grows for the beauty of the science they portray, and the communicative power they hold. Read all the blogs and find educational resources for all ages at: the Earth Science Week 2015 page.
You are the Project Scientist and Education and Public Outreach (EPO) lead for the Rad-X Project. What is Rad-X, why is it important, and what is the EPO and project scientist's role?
NASA's Radiation Dosimetry Experiment, or RaD-X, is a low-cost, high-altitude balloon project. Its mission is to help us understand and quantify cosmic ray exposure at the top of atmosphere. That's the zone where commercial airlines fly. This is important because these cosmic rays are a primary source of ionizing radiation in the atmosphere and increase the risk of cancer and other health impacts. A pilot absorbs as much radiation as a worker in a nuclear power plant, yet the dose of radiation they receive during a cosmic storm or during the span of their career is not quantified or documented.
The RaD-X payload consists of four radiation sensors that are used to measure incoming radiation. The RaD-X payload was launched on September 25, 2015 via a high-altitude research balloon. This supplements NASA's Nowcast of Atmospheric Ionizing Radiation for Aviation Safety (NAIRAS) model, which helps us make informed decisions about radiation exposure safety for flight crews, the general public, and commercial space operations. RaD-X also supported Cubes in Space on their inaugural balloon flight, which carried various science projects from schools across the U.S. Cubes in Space is a global design contest in which teams of secondary school students from around the world develop unique science experiments for launch into the upper atmosphere. During the 24-hour mission, the RaD-X payload and Cubes in Space experienced altitudes above 100,000 ft. during the day and above 60,000 ft. during the night.
On RaD-X, I had dual roles. First as the Project Scientist it was my job to serve as an interface between the scientists and engineers. Essentially, to help them speak the same language and communicate effectively. I was also the EPO lead. This included coordinating school visits, developing fact sheets, and interfacing with NASA Langley Research Center’s public affairs and communications.
How do you use Earth visualizations? Does it have applications to the Rad-X project?
Using data from the NAIRAS model, we create visualizations of predicted radiation exposure at multiple altitudes. These show exposure rates at aircraft levels and a vertical profile on global exposure rates. Now that we have successfully launched the Rad-X mission, we have started to analyze real data. During the launch we monitored (in real-time) how the measurements compared with the model predicted values from NAIRAS. Creating visualizations in real-time made the comparisons easier to interpret.

The vertical profile of a flight from New York to London shows effective radiation dose (microSievert/hr) exposure increases with flight altitude, as indicated by a color change between 11km and 15km.
How important is communication in your job as a scientist? Do you ever use visualizations to communicate your research?
Communication is absolutely key in conveying the importance of the mission and my work. I have to be able to clearly describe complex ideas in a meaningful way and when I see the audience nod in understanding, it is very satisfying. NASA's work is so important; we need to show how the investments the government makes in science are essential to improving the world around us.
Using visualizations is vital to clear communication. It is sometimes more effective to show people what the data says, rather than tell them what the data says. For instance in the case of RaD-X, what if I told you there was a strong solar storm that affected our upper atmosphere to the point where the north and south poles had high radiation exposure levels. Would that mean anything to you? But, if I used a visualization that showed how an increased exposure level changed over time or how the storm affects exposure levels for a flight route over the poles, then it would make sense. The picture conveys so much more without the need for a lot of words.
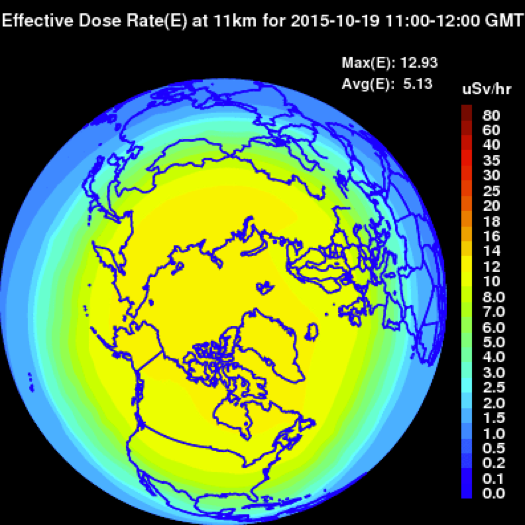
NAIRAS data shows current radiation exposure levels at the north pole. Visualizations are critical in communicating the significance of the mission's research.
What's your favorite part about your job?
My favorite part is communication. My work contributes a small part to the understanding of our natural world. So communicating how my research intersects with everyday life is utterly rewarding. Sharing my work with a variety of people nurtures my desire to continue working hard. It’s a wonderful positive feedback loop!
When you were a student, what interest/hobby led you to the work you’re doing now?
In college, you would have thought I was a drama or theater major instead of science, because I was interested in different ways to express myself. It was learning how to express myself that has served me well in my current career. I love to talk and share with people. I am comfortable with communicating to a variety of audiences, and I owe that to my varied interests when I was younger.
What suggestions/advice do you have to get young girls more interested in science and engineering?
My advice is the same advice my mama gave me growing up, which I'll summarize as "Life's journey is full of highs and lows, rewards and challenges. It is perseverance and belief in you and your abilities that will see you through. Knowing your worth and fully believing in it, will allow you to visualize you doing exactly what you were meant to do." And to my under-represented young girls in science, use your talents and passions to pursue your calling. Know that in doing so, you are role models and are laying the foundation for those who will come after you. Do not be afraid to be great.
-- Erica Alston, Research Scientist NASA Langley Research Center
Erica Alston earned her Ph.D. in Earth and Atmospheric sciences, concentrating in remote sensing from the Georgia Institute of Technology and a Masters and Bachelors of Science in Mathematical Science at Clark Atlanta University. Outside of work she enjoys being an amateur astronomer, especially around fall. She also loves reading and singing opera, when she’s not on mommy patrol (though mommy patrol is enjoyable too!)
For More Information
Credits
Please give credit for this item to:
NASA's Scientific Visualization Studio
-
Interviewee
- Erica Alston (NASA/LaRC)
-
Project support
- Leann Johnson (Global Science and Technology, Inc.)
Release date
This page was originally published on Wednesday, October 21, 2015.
This page was last updated on Wednesday, May 3, 2023 at 1:49 PM EDT.