Sixteen Comets Touring the Inner Solar System
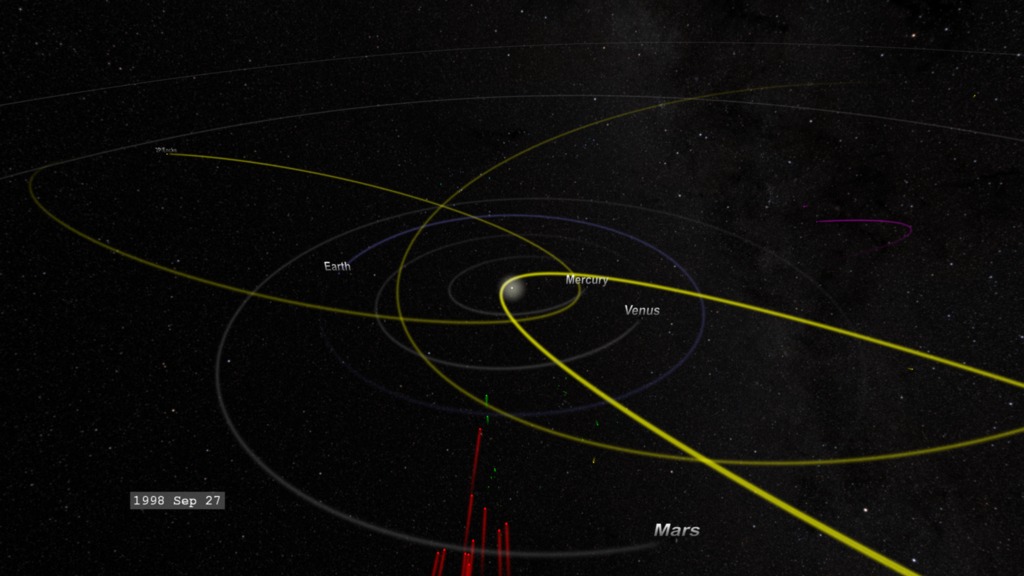
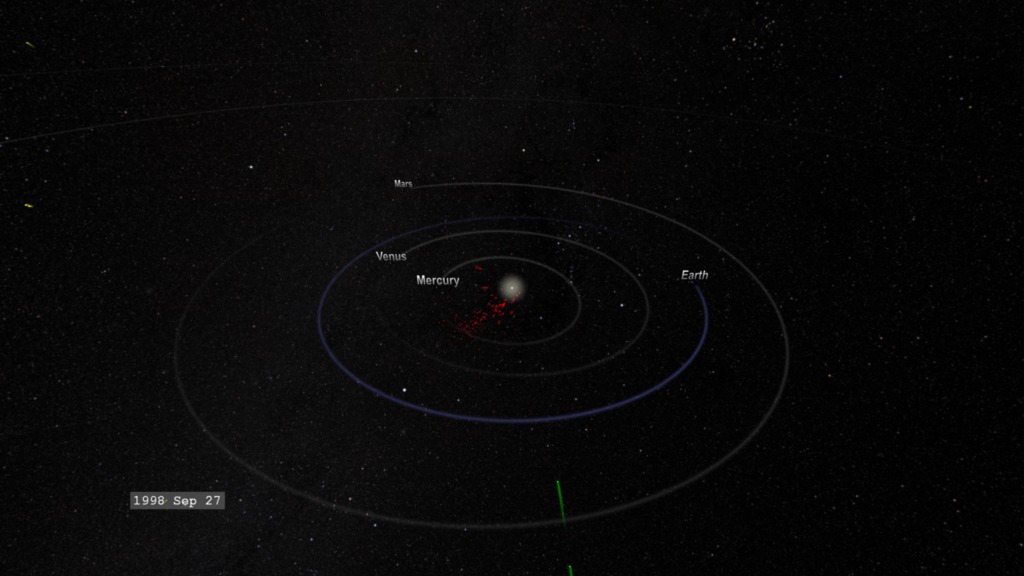
This visualization presents a small sample of the 9 years of comets seen by SOHO from the perspective a an observer at a fixed point above the ecliptic plane with the Sun at the center.
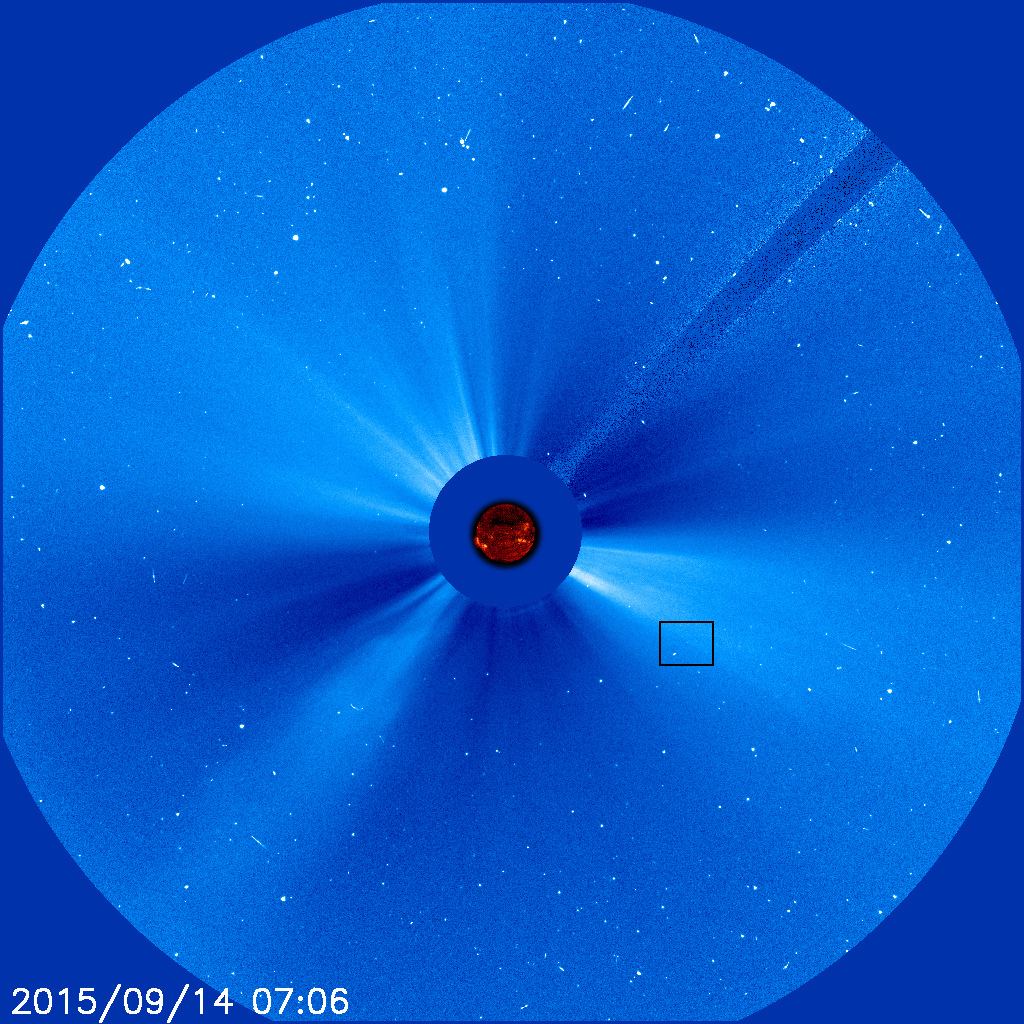
Stationed in a halo orbit around the Earth-Sun Lagrange point since 1996, the Solar and Heliospheric Observatory (SOHO) has monitored the Sun for nearly 20 years. The Large Angle and Spectrometric Coronagraph (LASCO) instrument blocks out the bright solar disk, making it easier to see the corona of plasma and dust around the Sun, normally only visible during solar eclipses. This instrument also provides a very large field of view of the region around the Sun.
In addition to the benefit of this capability in solar studies, SOHO/LASCO can see many comets which pass very close to the Sun, called 'sungrazers'. Observers on Earth rarely see these objects as they are obstructed by the Sun's glare and Earth's atmospheric scattering at sunrise and sunset. SOHO/LASCO has seen not only many known comets, but discovered many more NEW sungrazing comets. At the time of this writing, the discovery count is approaching 3000.
There are nearly sixteen comets and trajectories plotted in these visualizations which covers the time frame from January 2005 to December 2013 at the rate of one frame of the movie corresponding to one day.
The trails are color coded based on group membership.
Yellow - non-periodic comets Cyan - Periodic comets
Important Notes and Caveats:
- The trails represent the orbital path of the comet nucleus, NOT the meant to represent the comet tail.
- This visualization was actually a small 'test of concept' for the larger visuals, 'Lots of Comets', linked below.
- Naval Research Laboratory (NRL) Sungrazing Comets Page
This visualization presents a small sample of the 9 years of comets seen by SOHO from the perspective a an observer orbiting a fixed point above the ecliptic plane with the Sun at the center.
This visualization presents a small sample of the 9 years of comets seen by SOHO from the perspective a an observer above the ecliptic plane looking 'down' on the solar system with the Sun at the center.
This visualization presents a small sample of the 9 years of comets seen by SOHO from the perspective a an observer at a fixed point in the ecliptic plane with the Sun at the center.
Credits
Please give credit for this item to:
NASA's Scientific Visualization Studio
-
Visualizer
- Tom Bridgman (Global Science and Technology, Inc.)
-
Producers
- Genna Duberstein (USRA)
- Scott Wiessinger (USRA)
-
Scientist
- Karl Battams (Naval Research Laboratory)
-
Writer
- Karen Fox (ADNET Systems, Inc.)
Release date
This page was originally published on Tuesday, September 15, 2015.
This page was last updated on Wednesday, May 3, 2023 at 1:49 PM EDT.
Missions
This visualization is related to the following missions:Series
This visualization can be found in the following series:Datasets used in this visualization
-
SPICE Ephemerides (SPICE Ephemerides)
ID: 755Satellite and planetary ephemerides
See all pages that use this dataset -
Sungrazer Collection (Knight-Pierce Sungrazer Collection)
ID: 890
Note: While we identify the data sets used in these visualizations, we do not store any further details, nor the data sets themselves on our site.
Related
- ID: 4343
 Visualization
 - ID: 4344
 Visualization
 - ID: 11975
 Produced Video