IMERG Precipitation Rates from Hurricane Bertha
Animation showing the precipitation left by Hurricane Bertha as it churned off the United States East Coast. It then weakens from Hurricane status. However, despite it's loss of Hurricane strength, the remaining storm proceeds to march across the Atlantic eventually drenching the United Kingdom.
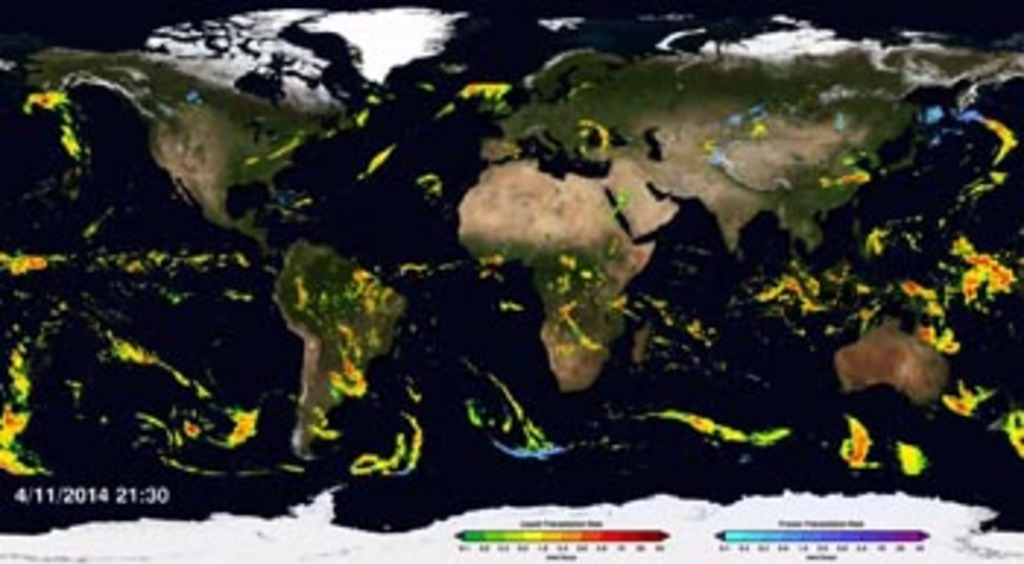
NASA's Global Precipitation Measurement mission has produced its first global map of rainfall and snowfall. The GPM Core Observatory launched one year ago on Feb. 27, 2014 as a collaboration between NASA and the Japan Aerospace Exploration Agency and acts as the standard to unify precipitation measurements from a network of 12 satellites. The result is NASA's Integrated Multi-satellitE Retrievals for GPM data product, called IMERG, which combines data from all 12 satellites into a single, seamless map. The map covers more of the globe than any previous precipitation data set and is updated every half hour, allowing scientists to see how rain and snow storms move around nearly the entire planet. As scientists work to understand all the elements of Earth's climate and weather systems, and how they could change in the future, GPM provides a major step forward in providing the scientific community comprehensive and consistent measurements of precipitation.

Color bar for liquid precipitation rates (ie, rain rates). Shades of green represent low amounts of liquid precipitation, whereas shades of red represent high amounts of precipitation.
Credits
Please give credit for this item to:
NASA's Scientific Visualization Studio
-
Animators
- Alex Kekesi (Global Science and Technology, Inc.)
- Kel Elkins (USRA)
- Greg Shirah (NASA/GSFC)
-
Data visualizer
- Horace Mitchell (NASA/GSFC)
-
Scientists
- George Huffman (NASA/GSFC)
- Gail Skofronick Jackson (NASA/GSFC)
- Dalia B Kirschbaum (NASA/GSFC)
-
Producers
- Ryan Fitzgibbons (USRA)
- Rani Gran (NASA/GSFC)
Release date
This page was originally published on Tuesday, March 31, 2015.
This page was last updated on Wednesday, May 3, 2023 at 1:49 PM EDT.
Missions
This visualization is related to the following missions:Series
This visualization can be found in the following series:Datasets used in this visualization
-
IMERG
ID: 863This dataset can be found at: http://pmm.nasa.gov/sites/default/files/document_files/IMERG_ATBD_V4.4.pdf
See all pages that use this dataset
Note: While we identify the data sets used in these visualizations, we do not store any further details, nor the data sets themselves on our site.
Related
- ID: 11826
 Produced Video
 - ID: 11829
 Produced Video