Accumulated Precipitation from the IMERG Global Precipitation Data
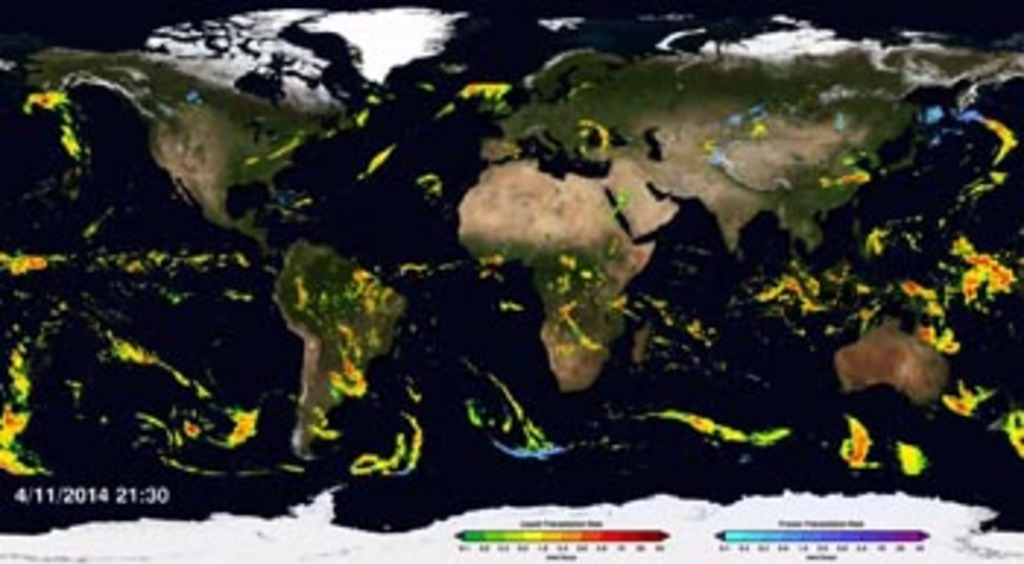
An animation showing global precipitation accumulating from 8/4/2014 through 8/10/2014. The very large accumulation near Japan is Typhoon Halong. This accumulation is calculated from the IMERG precipitation dataset.
This video is also available on our YouTube channel.
The global IMERG precipitation dataset provides rainfall rates for the entire world every thirty minutes. Using this dataset, it is possible to calculate the amount of accumulated rainfall for any region over a period of time. This animation shows the accumulation of rainfall across the globe for a week in August, 2014. In addition to the dramatic accumulation near Japan due to Typhoon Halong and the track of Hurricane Bertha off the eastern coast of the United States, it is also possible to see a rare August storm over the North Sea near Europe, the origins of Hurricane Gonzalo on the western coast of Africa, and a deep tropical depression that produced floods across northern India.
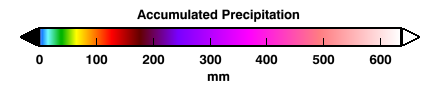
The colorbar for accumulated precipitation.
Credits
Please give credit for this item to:
NASA's Scientific Visualization Studio
-
Data visualizer
- Horace Mitchell (NASA/GSFC)
-
Scientists
- George Huffman (NASA/GSFC)
- Gail Skofronick Jackson (NASA/GSFC)
- Dalia B Kirschbaum (NASA/GSFC)
-
Producer
- Ryan Fitzgibbons (USRA)
Release date
This page was originally published on Tuesday, March 31, 2015.
This page was last updated on Tuesday, November 14, 2023 at 12:06 AM EST.
Missions
This visualization is related to the following missions:Series
This visualization can be found in the following series:Datasets used in this visualization
-
IMERG
ID: 863This dataset can be found at: http://pmm.nasa.gov/sites/default/files/document_files/IMERG_ATBD_V4.4.pdf
See all pages that use this dataset
Note: While we identify the data sets used in these visualizations, we do not store any further details, nor the data sets themselves on our site.
Related
- ID: 11860
- ID: 11826
 Produced Video
 - ID: 11829
 Produced Video