Link between Sea-Ice Fraction and Absorbed Solar Radiation over the Arctic Ocean
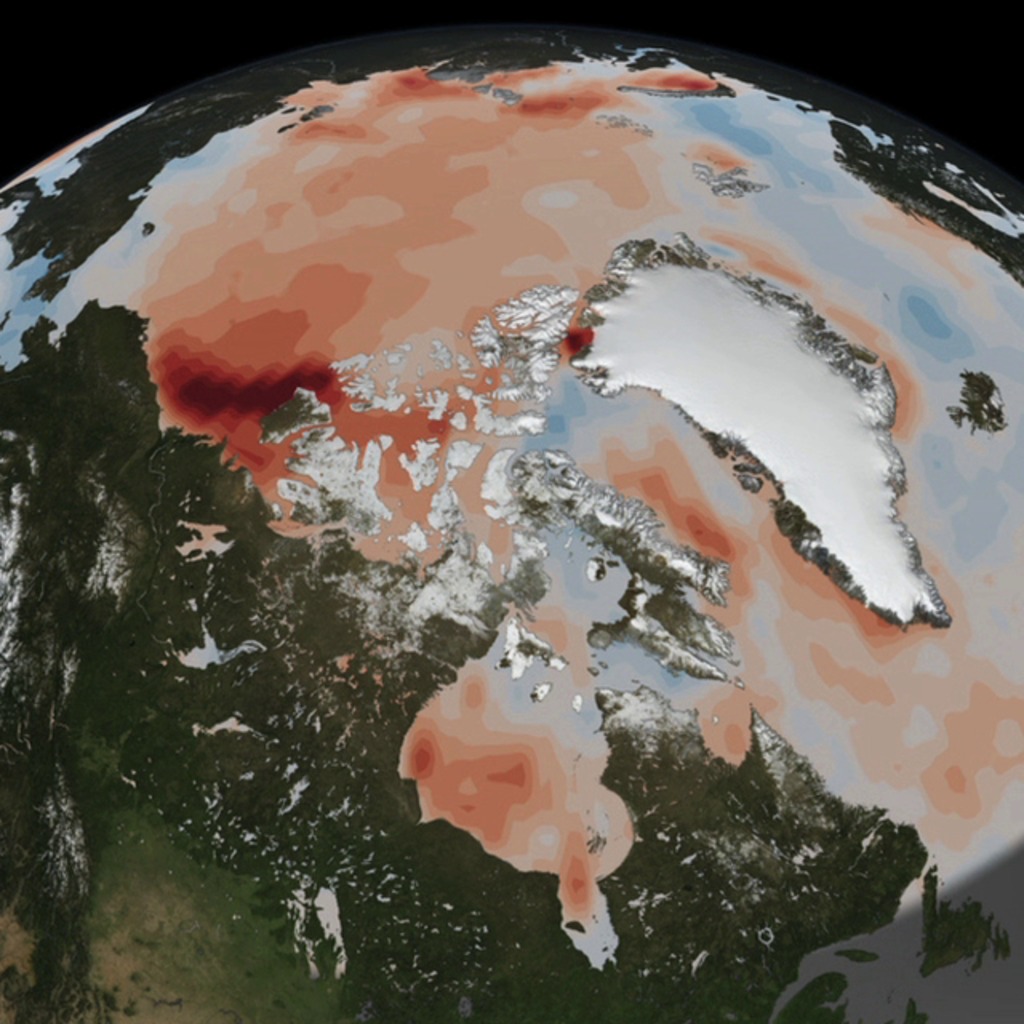
NASA satellite instruments have observed a marked increase in solar radiation absorbed in the Arctic since the year 2000 – a trend that aligns with the drastic decrease in Arctic sea ice during the same period. This visual shows the Arctic Sea Ice Change and the corresponding Absorbed Solar Radiation Change during June, July, and August from 2000 through 2014.
This video is also available on our YouTube channel.
While sea ice is mostly white and reflects the sun’s rays, ocean water is dark and absorbs the sun’s energy at a higher rate. A decline in the region’s albedo – its reflectivity, in effect – has been a key concern among scientists since the summer Arctic sea ice cover began shrinking in recent decades. As more of the sun’s energy is absorbed by the climate system, it enhances ongoing warming in the region, which is more pronounced than anywhere else on the planet.
Since the year 2000, the rate of absorbed solar radiation in the Arctic in June, July and August has increased by five percent, said Norman Loeb, of NASA’s Langley Research Center, Hampton, Virginia. The measurement is made by NASA’s Clouds and the Earth’s Radiant Energy System (CERES) instruments, which fly on multiple satellites.
While a five percent increase may not seem like much, consider that the rate globally has remained essentially flat during that same time. No other region on Earth shows a trend of potential long-term change.
When averaged over the entire Arctic Ocean, the increase in the rate of absorbed solar radiation is about 10 Watts per square meter. This is equivalent to an extra 10-watt light bulb shining continuously over every 10.76 square feet of Arctic Ocean for the entire summer.
As a region, the Arctic is showing more dramatic signs of climate change than any other spot on the planet. These include a warming of air temperatures at a rate two to three times greater than the rest of the planet and the loss of September sea ice extent at a rate of 13 percent per decade.
CERES instruments fly on the Terra, Aqua and Suomi-NPP satellites, and one is scheduled to fly on the next orbiter of the Joint Polar Satellite System, a NASA-NOAA effort. The Terra satellite launched Dec. 18, 1999, and CERES first started collecting Arctic data in 2000 so 2015 will mark 15 continuous years of CERES measurements over the Arctic.
The instruments include three radiometers – one measuring solar radiation reflected by Earth (shortwave), one measuring thermal infrared radiation emitted by Earth (longwave), and one measuring all outgoing radiation, whether emitted or reflected.
For more information on the project, please visit http://ceres.larc.nasa.gov.

Colorbars for both Sea Ice Change and Absorbed Solar Radiation
Sea-Ice Fraction Change during June, July, and August from 2000 through 2014 (CERES period)
Top-of_Atmosphere (TOA) Absorbed Solar Radiation during June, July, and August from 2000 through 2014 (CERES period)
Side by side comparison of Sea-Ice Fraction and TOA Absorbed Solar Radiation Change
Same Sea-Ice Fraction image from above with color bar and text
Same TOA Absorbed Solar Radiation Change image from above with colorbar and text overlay.
Sea-Ice Fraction Change during June, July, and August from 2000 through 2014 (CERES period)
This version is designed to be displayed on the Science On a Sphere device.
Top-of_Atmosphere (TOA) Absorbed Solar Radiation during June, July, and August from 2000 through 2014 (CERES period). This version is designed to be displayed on the Science On A Sphere device.
Credits
Please give credit for this item to:
NASA's Scientific Visualization Studio
-
Animators
- Lori Perkins (NASA/GSFC)
- Horace Mitchell (NASA/GSFC)
-
Producer
- Patrick Lynch (Wyle Information Systems)
-
Scientist
- Norman Loeb (NASA/LRC)
-
Project support
- Laurence Schuler (ADNET Systems, Inc.)
- Ian Jones (ADNET Systems, Inc.)
-
Writer
- Patrick Lynch (Wyle Information Systems)
Release date
This page was originally published on Wednesday, December 17, 2014.
This page was last updated on Wednesday, May 3, 2023 at 1:50 PM EDT.
Series
This visualization can be found in the following series:Datasets used in this visualization
-
Incoming Solar Radiation [Aqua: CERES]
ID: 242Data from SORCE for the flux magnitude at the Earth's orbit, coupled with solar incidence angles based on CERES measurement locations and times
See all pages that use this dataset -
Blue Marble [Aqua: MODIS]
ID: 252Credit: The Blue Marble data is courtesy of Reto Stockli (NASA/GSFC).
See all pages that use this dataset
Note: While we identify the data sets used in these visualizations, we do not store any further details, nor the data sets themselves on our site.
Related
- ID: 10281
 Produced Video