August 24, 2014: Magnificent M-flare
M-flares are not the most powerful flares the Sun can emit, but sometimes even they can exhibit visually exciting behavior.
Here we show the lead-up to an M-flare which lauches a large amount of plasma into space. The eruption takes place starting around 12:00 UTC and launches over the next 15 minutes. But stay with it, and you'll also see some of the plasma falling back towards the Sun around 13:50 UTC.
The flare at ejected CME launches from the western limb of the Sun (lower left of image) in this sequence from the SDO/AIA 131 angstrom filter.
The flare at ejected CME launches from the western limb of the Sun (lower left of image) in this sequence from the SDO/AIA 171 angstrom filter.
The flare at ejected CME launches from the western limb of the Sun (lower left of image) in this sequence from the SDO/AIA 304 angstrom filter.
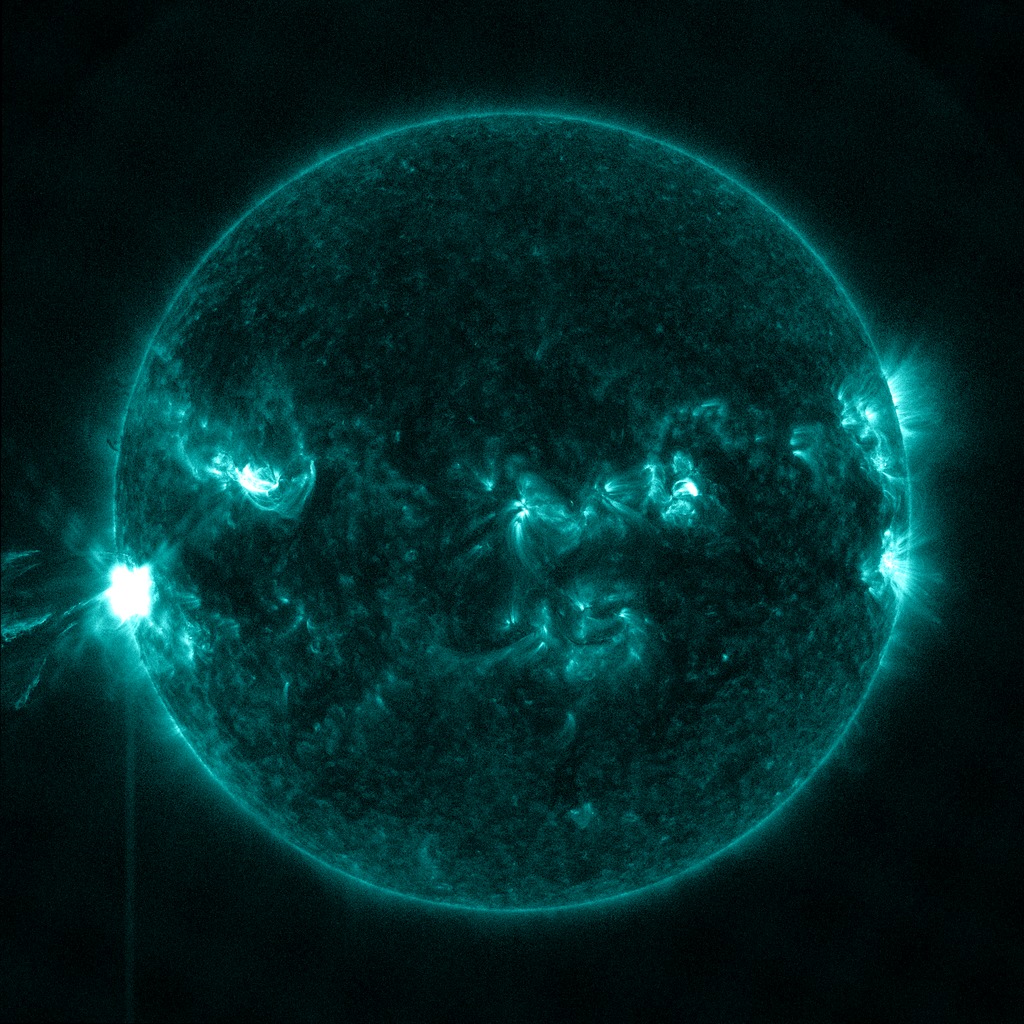
The flare at ejected CME launches from the western limb of the Sun (lower left of image) in this sequence from the SDO/AIA 131 angstrom filter. Full resolution 4Kx4K frames.
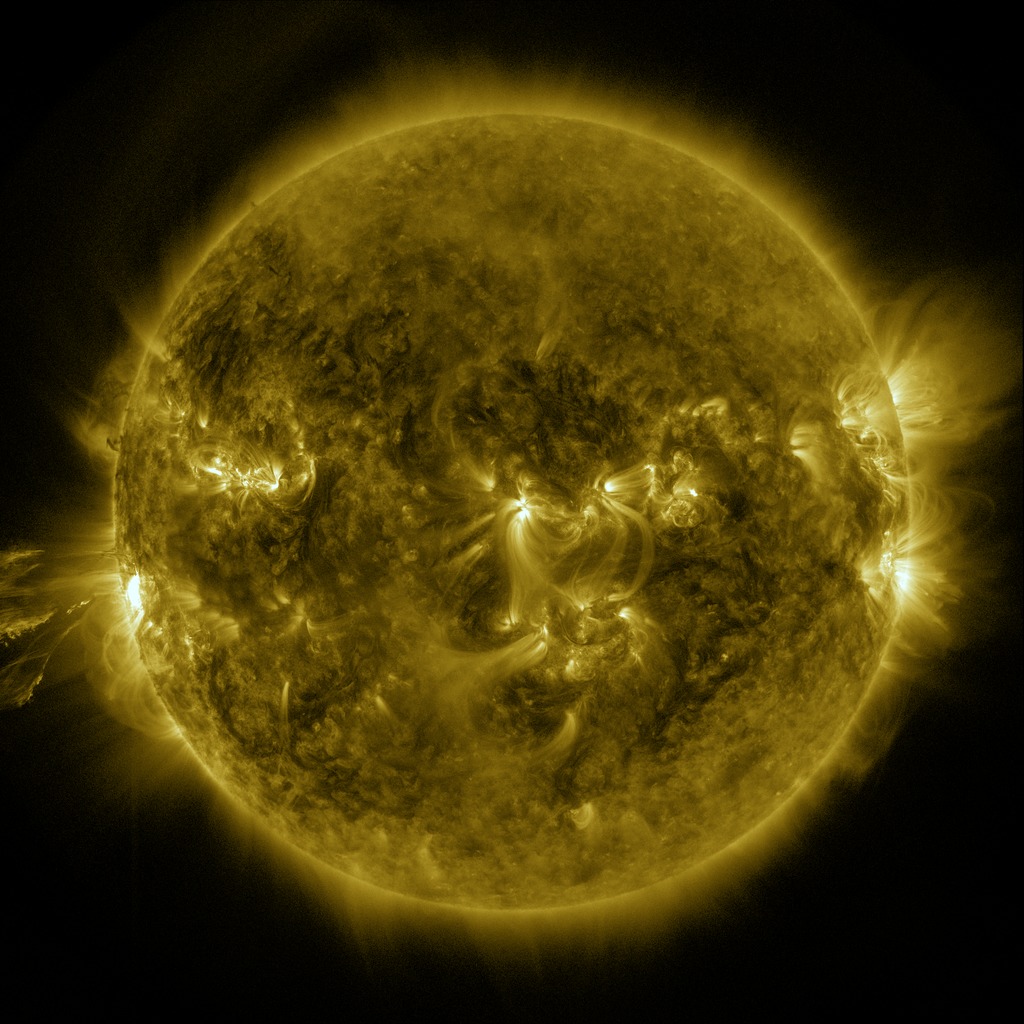
The flare at ejected CME launches from the western limb of the Sun (lower left of image) in this sequence from the SDO/AIA 171 angstrom filter. Full resolution 4Kx4K frames.
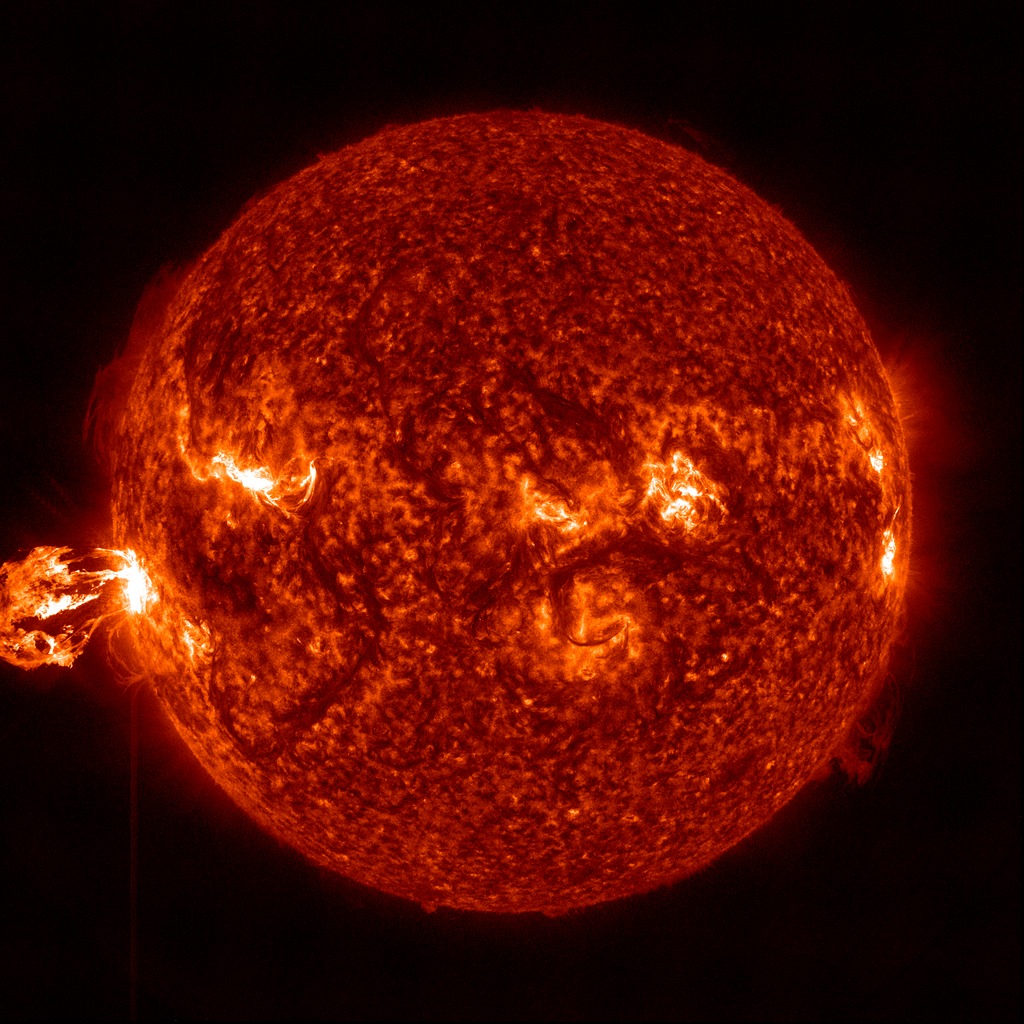
The flare at ejected CME launches from the western limb of the Sun (lower left of image) in this sequence from the SDO/AIA 304 angstrom filter. Full resolution 4Kx4K frames.
Credits
Please give credit for this item to:
NASA's Scientific Visualization Studio, the SDO Science Team, and the Virtual Solar Observatory.
-
Animator
- Tom Bridgman (Global Science and Technology, Inc.)
-
Producer
- Genna Duberstein (USRA)
-
Project support
- Laurence Schuler (ADNET Systems, Inc.)
- Ian Jones (ADNET Systems, Inc.)
-
Scientist
- William D. Pesnell (NASA/GSFC)
Release date
This page was originally published on Wednesday, February 11, 2015.
This page was last updated on Wednesday, May 3, 2023 at 1:50 PM EDT.
Missions
This visualization is related to the following missions:Series
This visualization can be found in the following series:Datasets used in this visualization
-
AIA 304 (304 Filter) [SDO: AIA]
ID: 677This dataset can be found at: http://jsoc.stanford.edu/
See all pages that use this dataset -
AIA 171 (171 Filter) [SDO: AIA]
ID: 680This dataset can be found at: http://jsoc.stanford.edu/
See all pages that use this dataset -
AIA 131 (131 Filter) [SDO: AIA]
ID: 730This dataset can be found at: http://jsoc.stanford.edu/
See all pages that use this dataset
Note: While we identify the data sets used in these visualizations, we do not store any further details, nor the data sets themselves on our site.
Related
- ID: 11742
 Produced Video