West Antarctic Collapse
A new study by researchers at NASA and the University of California, Irvine, finds a rapidly melting section of the West Antarctic Ice Sheet appears to be in an irreversible state of decline, with nothing to stop the glaciers in this area from melting into the sea according to glaciologist and lead author Eric Rignot, of UC Irvine and NASA's Jet Propulsion Laboratory in Pasadena, California.
Three major lines of evidence point to the glaciers' eventual demise: the changes in their flow speeds, how much of each glacier floats on seawater, and the slope and depth of the terrain they are flowing over. In a paper in April, Rignot's research group discussed the steadily increasing flow speeds of these glaciers over the past 40 years. This new study examines the other two lines of evidence.
As glaciers flow out from land to the ocean, large expanses of ice behind their leading edges float on the seawater. The point on a glacier where it first loses contact with land is called the grounding line. Nearly all glacier melt occurs on the underside of the glacier beyond the grounding line, on the section floating on seawater. The Antarctic glaciers studied have thinned so much they are now floating above places where they used to sit solidly on land, which means their grounding lines are retreating inland.
The bedrock topography is another key to the fate of the ice in this basin. All the glacier beds slope deeper below sea level as they extend farther inland. As the glaciers retreat, they cannot escape the reach of the ocean, and the warm water will keep melting them even more rapidly.
Below are two edited versions of narrated stories released by JPL to explain this research. In addition are the two versions of the unedited animations provided to JPL to support the release. The unedited animations show the region of study by the JPL researchers, identifying by name the glaciers that terminate in the Amundsen Sea. One of the animations includes data showing the velocity of the glaciers in the region, flow vectors showing the movement of the glaciers colored by their velocity and a difference image showing the change in velocity between 1996 and 2008. The second animation does not include these datasets.
Both versions of the animation draw close to the Smith Glacier and show how the grounding line of this glacier has moved inland 35 kilometers between 1996 and 2011. As the surface of the ice sheet is peeled away, showing the height and depth of the bedrock topography. Regions below sea level are shown in shades of brown while areas above sea level are shown in green. Sea level is shown in yellow.
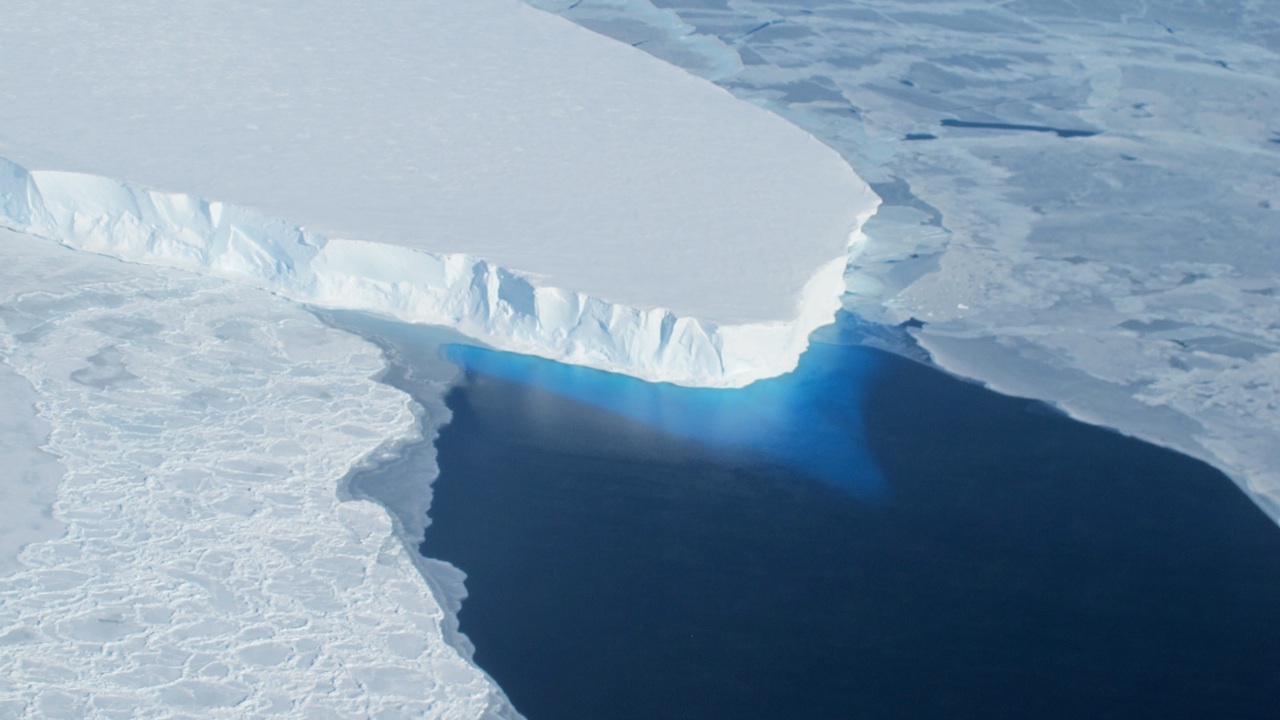
The above movie, entitled "West Antarctic Glaciers: Past the Point of No Return", uses a collage of live footage and animation to explain the changes that are occurring on the West Antarctic Ice Sheet. This movie is narrated by glaciologist Eric Rignot.
The above movie entitled "Runaway Glaciers in West Antarctica" is an edited version of the original animation below narrated by glaciologist Eric Rignot.
This is the complete, unedited animation that includes the velocity data and the flow lines as well as the 1996 and 2011 grounding lines for the Smith Glacier.
This is a truncated version of the animation above without the velocity data. This animation shows the glacier locations and the grounding line locations but does not include the velocity data, the velocity difference data between 1996 and 2008 or the flow lines colored by velocity. This version stops at the Smith Glacier and does not pull out to see the West Antarctic Ice Sheet at the end.

A print resolution still image of the velocity of the ice sheet over West Antarctica. The colorbar indicating the values associated with the colors is available below.
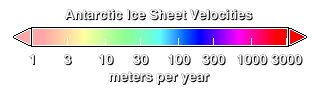
Colorbar for the ice sheet velocity
A print resolution still image showing the area where the glaciers flow into the Amundsen Sea. Floating ice shelves at the base of the glaciers are shown in a pale blue-grey color. Flow lines colored by the ice sheet's velocity indicate where the ice sheet is moving the most. The colorbar used for the flow lines is shown below.
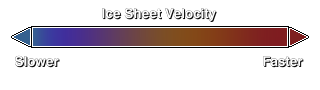
The colorbar used to color the flow vectors above
A print resolution image showing the change in velocity for glaciers flowing into the Amundsen Sea between 1996 and 2008. The colorbar is below.
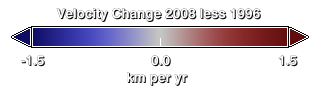
Colorbar showing the change in velocity between 1996 and 2008. Red indicates an increase in velocity while blue indicates a decrease.
A print resolution still image showing the change in the velocity between 1996 and 2008 for the Haynes, Pope, Smith and Kohler glaciers. The colorbar is shown above.
A print resolution image showing the glaciers flowing onto the Crosson and Dotson Ice Shelves. The ice shelves, shown with a slight blueish-white color, are regions where the glacial ice is floating on water. The whiter areas pointed to by the arrows indicate glaciers over bedrock. The grounding line shown here, the point at which the glaciers leave the bedrock and begin to float, is from 1996.
A print resolution image showing the Smith Glacier and the adjacent ice shelves. The ice shelves, shown with a slight blueish-white color, are regions where the glacial ice is floating on water. The whiter areas pointed to by the arrow indicates where the glacier is over bedrock. The grounding line shown here, the point at which the glacier leaves the bedrock and begin to float, is from 1996.
A print resolution image showing the Smith Glacier and the adjacent ice shelves. Here the region covered by the ice shelves is colored blue. The white area shows where the glacier is over bedrock. The boundary between the blue and the white indicates the location of the grounding line in 1996.
A print resolution image showing the Smith Glacier and the adjacent ice shelves. Here the region covered by the ice shelves is colored blue. The white area shows where the glacier is over bedrock. The boundary traced by the green line shows the location of the grounding line in 1996. The edge of the white region indicates the location of the grounding line in 2011, which has retreated inland 35 km from the 1996 location. The area between the 1996 and 2011 grounding lines is shown as semi-transparent in order to view the depth of the valley beneath the glacier.
A print resolution image showing the Smith Glacier and the adjacent ice shelves. Here the region covered by the ice shelves is colored blue. The white area shows where the glacier is over bedrock. The boundary between the blue and the white indicates the location of the grounding line in 2011. The green line indicates the location of the grounding line in 1996. Note the grounding line has retreated 35 km inland between 1996 and 2011.
A print resolution image of the terrain below the glaciers flowing into the Amundsen Sea. Here, regions of bedrock below sea level are shown in shades of brown where darker brown indicates deeper valleys. The areas above sea level are shown in shades of green and sea level is shown in yellow. Note the deep subglacial valleys behind the Pine Island and Thwaites glaciers. The colorbar used to color the bedrock is shown below.

The colorbar used to color the topography under the West Antarctic Ice Sheet.
A print resolution image of the terrain below the West Antarctic Ice Sheet. Here, regions of bedrock below sea level are shown in shades of brown where darker brown indicates deeper valleys. The areas above sea level are shown in shades of green and sea level is shown in yellow. Note the large subglacial valleys feeding the glaciers flowing into the Amundsen Sea. The colorbar used to color the bedrock is shown above.
For More Information
Credits
Please give credit for this item to:
NASA's Scientific Visualization Studio
-
Visualizer
- Cindy Starr (Global Science and Technology, Inc.)
-
Animators
- Horace Mitchell (NASA/GSFC)
- Greg Shirah (NASA/GSFC)
-
Video editor
- Henry Kline (NASA/JPL CalTech)
-
Narrator
- Eric J. Rignot (NASA/JPL CalTech)
-
Producers
- Carol Rasmussen (NASA/JPL CalTech)
- Gay Y. Hill (NASA/JPL CalTech)
- Patrick Lynch (Wyle Information Systems)
-
Scientists
- Eric J. Rignot (NASA/JPL CalTech)
- Jeremie Mouginot (University of California, Irvine)
- Bernd Scheuchl (University of California, Irvine)
- Mathieu Morlighem (University of California, Irvine)
- Helene Seroussi (NASA/JPL CalTech)
-
Project support
- Laurence Schuler (ADNET Systems, Inc.)
- Ian Jones (ADNET Systems, Inc.)
- Joycelyn Thomson Jones (NASA/GSFC)
- Leann Johnson (Global Science and Technology, Inc.)
- Eric Sokolowsky (Global Science and Technology, Inc.)
-
Writer
- Carol Rasmussen (NASA/JPL CalTech)
Release date
This page was originally published on Thursday, May 29, 2014.
This page was last updated on Tuesday, November 14, 2023 at 12:05 AM EST.
Missions
This visualization is related to the following missions:Papers used in this visualization
Datasets used in this visualization
-
LIMA (Landsat Image Mosaic of Antarctica) [Landsat-7: ETM+]
ID: 599Mosaicing to avoid clouds produced a high quality, nearly cloud-free benchmark data set of Antarctica for the International Polar Year from images collected primarily during 1999-2003.
This dataset can be found at: http://lima.nasa.gov/
See all pages that use this dataset -
Bedmap2 (Antarctic Bedmap2 Topography)
ID: 786 -
Antarctic Ice Sheet Velocity
ID: 787 -
Glacier Grounding Lines
ID: 826 -
Annual Ice Sheet Velocity for Amdunsen Sea Embayment
ID: 827
Note: While we identify the data sets used in these visualizations, we do not store any further details, nor the data sets themselves on our site.
Related
- ID: 11540
 Produced Video